German Russian vs Immigrants from Dominican Republic Unemployment
COMPARE
German Russian
Immigrants from Dominican Republic
Unemployment
Unemployment Comparison
German Russians
Immigrants from Dominican Republic
4.9%
UNEMPLOYMENT
98.0/ 100
METRIC RATING
76th/ 347
METRIC RANK
7.4%
UNEMPLOYMENT
0.0/ 100
METRIC RATING
333rd/ 347
METRIC RANK
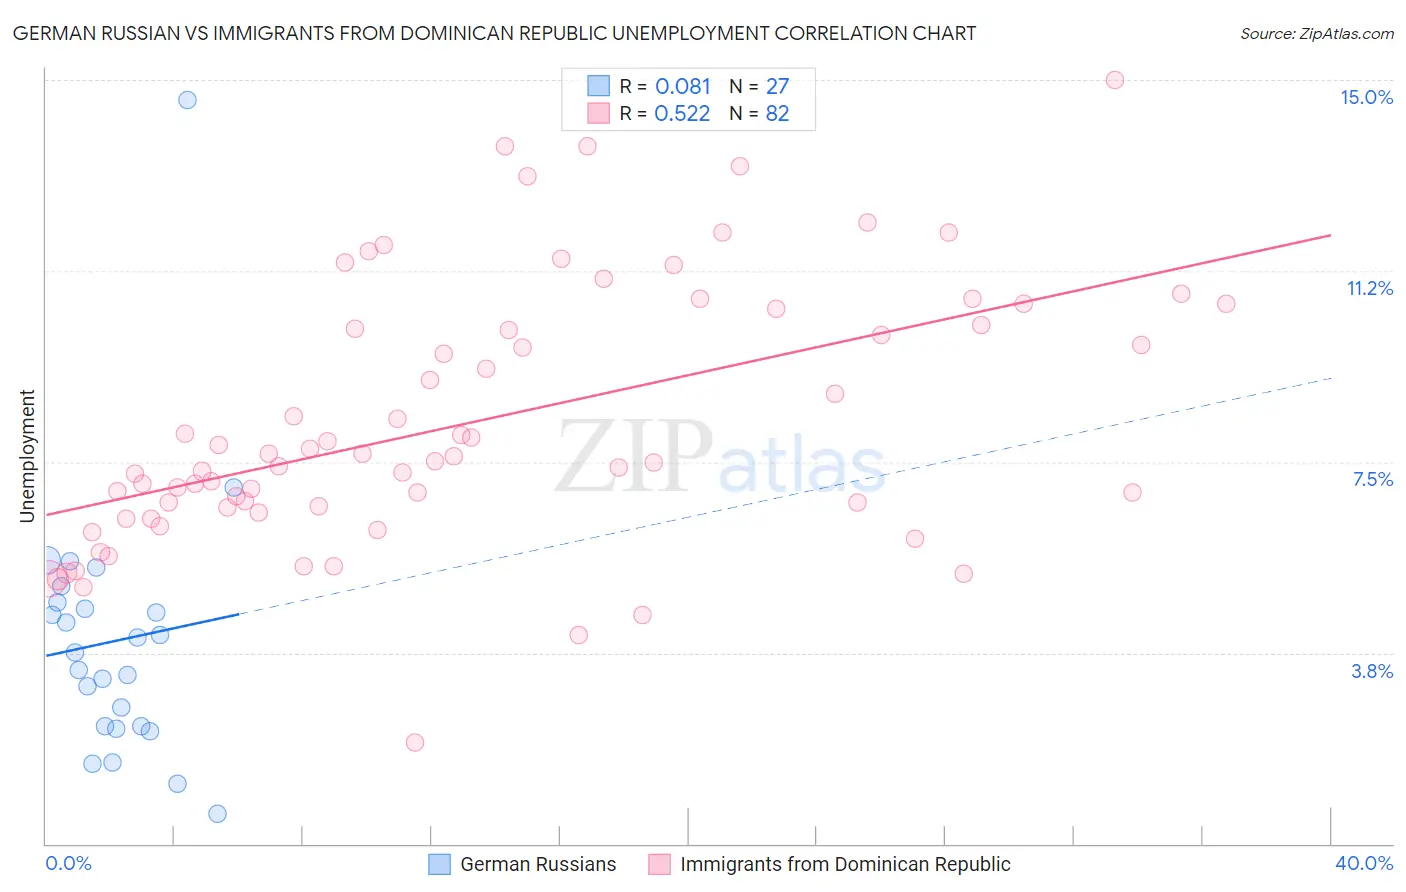
German Russian vs Immigrants from Dominican Republic Unemployment Correlation Chart
The statistical analysis conducted on geographies consisting of 96,379,174 people shows a slight positive correlation between the proportion of German Russians and unemployment in the United States with a correlation coefficient (R) of 0.081 and weighted average of 4.9%. Similarly, the statistical analysis conducted on geographies consisting of 274,892,404 people shows a substantial positive correlation between the proportion of Immigrants from Dominican Republic and unemployment in the United States with a correlation coefficient (R) of 0.522 and weighted average of 7.4%, a difference of 49.5%.
Unemployment Correlation Summary
| Measurement | German Russian | Immigrants from Dominican Republic |
| Minimum | 0.60% | 2.0% |
| Maximum | 14.6% | 15.0% |
| Range | 14.0% | 13.0% |
| Mean | 4.0% | 8.3% |
| Median | 3.8% | 7.6% |
| Interquartile 25% (IQ1) | 2.3% | 6.6% |
| Interquartile 75% (IQ3) | 4.7% | 10.2% |
| Interquartile Range (IQR) | 2.4% | 3.6% |
| Standard Deviation (Sample) | 2.6% | 2.6% |
| Standard Deviation (Population) | 2.6% | 2.5% |
Similar Demographics by Unemployment
Demographics Similar to German Russians by Unemployment
In terms of unemployment, the demographic groups most similar to German Russians are Turkish (4.9%, a difference of 0.030%), Cypriot (4.9%, a difference of 0.060%), Okinawan (4.9%, a difference of 0.10%), Immigrants from Northern Europe (4.9%, a difference of 0.16%), and Canadian (5.0%, a difference of 0.22%).
| Demographics | Rating | Rank | Unemployment |
| Immigrants | North America | 98.5 /100 | #69 | Exceptional 4.9% |
| Serbians | 98.4 /100 | #70 | Exceptional 4.9% |
| Immigrants | Japan | 98.3 /100 | #71 | Exceptional 4.9% |
| Burmese | 98.3 /100 | #72 | Exceptional 4.9% |
| Paraguayans | 98.3 /100 | #73 | Exceptional 4.9% |
| Immigrants | Northern Europe | 98.2 /100 | #74 | Exceptional 4.9% |
| Turks | 98.0 /100 | #75 | Exceptional 4.9% |
| German Russians | 98.0 /100 | #76 | Exceptional 4.9% |
| Cypriots | 97.9 /100 | #77 | Exceptional 4.9% |
| Okinawans | 97.9 /100 | #78 | Exceptional 4.9% |
| Canadians | 97.7 /100 | #79 | Exceptional 5.0% |
| Immigrants | Sweden | 97.6 /100 | #80 | Exceptional 5.0% |
| Basques | 97.6 /100 | #81 | Exceptional 5.0% |
| Fijians | 97.6 /100 | #82 | Exceptional 5.0% |
| Hmong | 97.6 /100 | #83 | Exceptional 5.0% |
Demographics Similar to Immigrants from Dominican Republic by Unemployment
In terms of unemployment, the demographic groups most similar to Immigrants from Dominican Republic are Sioux (7.4%, a difference of 0.060%), Apache (7.4%, a difference of 0.47%), Dominican (7.4%, a difference of 0.48%), Yakama (7.3%, a difference of 0.82%), and Alaska Native (7.2%, a difference of 2.1%).
| Demographics | Rating | Rank | Unemployment |
| Paiute | 0.0 /100 | #326 | Tragic 7.1% |
| Pueblo | 0.0 /100 | #327 | Tragic 7.2% |
| Tsimshian | 0.0 /100 | #328 | Tragic 7.2% |
| Alaska Natives | 0.0 /100 | #329 | Tragic 7.2% |
| Yakama | 0.0 /100 | #330 | Tragic 7.3% |
| Dominicans | 0.0 /100 | #331 | Tragic 7.4% |
| Sioux | 0.0 /100 | #332 | Tragic 7.4% |
| Immigrants | Dominican Republic | 0.0 /100 | #333 | Tragic 7.4% |
| Apache | 0.0 /100 | #334 | Tragic 7.4% |
| Alaskan Athabascans | 0.0 /100 | #335 | Tragic 7.7% |
| Immigrants | Yemen | 0.0 /100 | #336 | Tragic 7.7% |
| Cheyenne | 0.0 /100 | #337 | Tragic 8.0% |
| Pima | 0.0 /100 | #338 | Tragic 8.2% |
| Navajo | 0.0 /100 | #339 | Tragic 8.4% |
| Puerto Ricans | 0.0 /100 | #340 | Tragic 8.4% |