Immigrants from Ukraine vs Cuban Unemployment Among Women with Children Ages 6 to 17 years
COMPARE
Immigrants from Ukraine
Cuban
Unemployment Among Women with Children Ages 6 to 17 years
Unemployment Among Women with Children Ages 6 to 17 years Comparison
Immigrants from Ukraine
Cubans
8.6%
UNEMPLOYMENT AMONG WOMEN WITH CHILDREN AGES 6 TO 17 YEARS
97.4/ 100
METRIC RATING
111th/ 347
METRIC RANK
9.2%
UNEMPLOYMENT AMONG WOMEN WITH CHILDREN AGES 6 TO 17 YEARS
10.9/ 100
METRIC RATING
207th/ 347
METRIC RANK
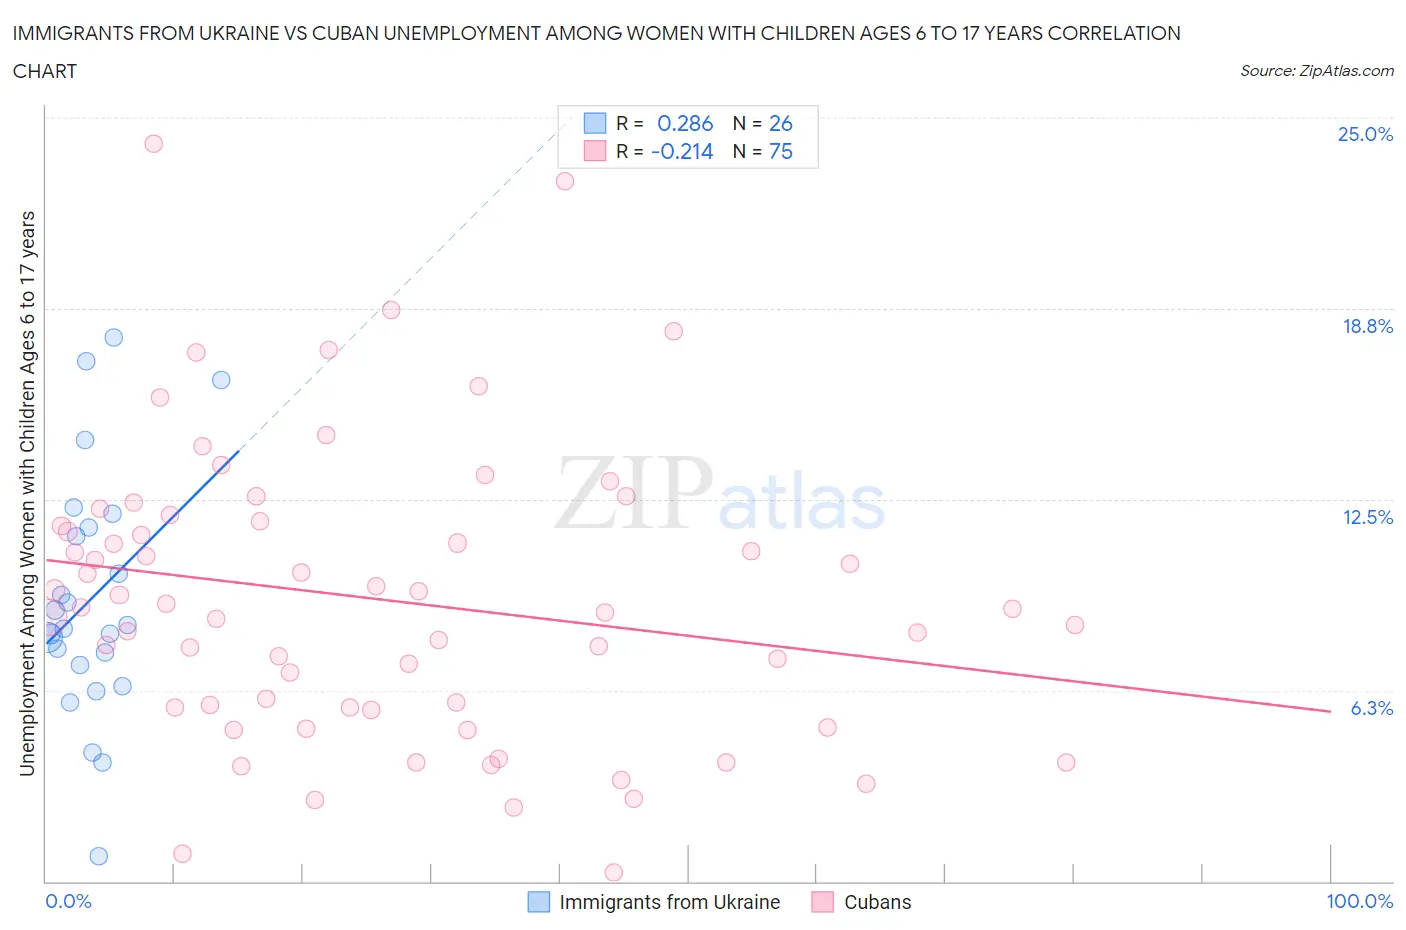
Immigrants from Ukraine vs Cuban Unemployment Among Women with Children Ages 6 to 17 years Correlation Chart
The statistical analysis conducted on geographies consisting of 215,687,583 people shows a weak positive correlation between the proportion of Immigrants from Ukraine and unemployment rate among women with children between the ages 6 and 17 in the United States with a correlation coefficient (R) of 0.286 and weighted average of 8.6%. Similarly, the statistical analysis conducted on geographies consisting of 317,366,594 people shows a weak negative correlation between the proportion of Cubans and unemployment rate among women with children between the ages 6 and 17 in the United States with a correlation coefficient (R) of -0.214 and weighted average of 9.2%, a difference of 6.6%.
Unemployment Among Women with Children Ages 6 to 17 years Correlation Summary
| Measurement | Immigrants from Ukraine | Cuban |
| Minimum | 0.80% | 0.30% |
| Maximum | 17.8% | 24.1% |
| Range | 17.0% | 23.8% |
| Mean | 9.3% | 9.2% |
| Median | 8.3% | 8.9% |
| Interquartile 25% (IQ1) | 7.1% | 5.7% |
| Interquartile 75% (IQ3) | 11.6% | 11.8% |
| Interquartile Range (IQR) | 4.5% | 6.1% |
| Standard Deviation (Sample) | 4.0% | 4.8% |
| Standard Deviation (Population) | 4.0% | 4.8% |
Similar Demographics by Unemployment Among Women with Children Ages 6 to 17 years
Demographics Similar to Immigrants from Ukraine by Unemployment Among Women with Children Ages 6 to 17 years
In terms of unemployment among women with children ages 6 to 17 years, the demographic groups most similar to Immigrants from Ukraine are Latvian (8.6%, a difference of 0.010%), Immigrants from Romania (8.6%, a difference of 0.020%), Swedish (8.6%, a difference of 0.090%), Chickasaw (8.6%, a difference of 0.10%), and Romanian (8.6%, a difference of 0.12%).
| Demographics | Rating | Rank | Unemployment Among Women with Children Ages 6 to 17 years |
| Immigrants | France | 98.0 /100 | #104 | Exceptional 8.6% |
| Immigrants | Norway | 97.8 /100 | #105 | Exceptional 8.6% |
| Immigrants | Serbia | 97.7 /100 | #106 | Exceptional 8.6% |
| Chickasaw | 97.6 /100 | #107 | Exceptional 8.6% |
| Swedes | 97.6 /100 | #108 | Exceptional 8.6% |
| Immigrants | Romania | 97.5 /100 | #109 | Exceptional 8.6% |
| Latvians | 97.4 /100 | #110 | Exceptional 8.6% |
| Immigrants | Ukraine | 97.4 /100 | #111 | Exceptional 8.6% |
| Romanians | 97.1 /100 | #112 | Exceptional 8.6% |
| Eastern Europeans | 96.8 /100 | #113 | Exceptional 8.6% |
| Immigrants | Russia | 96.7 /100 | #114 | Exceptional 8.6% |
| Argentineans | 96.5 /100 | #115 | Exceptional 8.6% |
| Zimbabweans | 96.3 /100 | #116 | Exceptional 8.6% |
| Albanians | 96.3 /100 | #117 | Exceptional 8.6% |
| Pueblo | 96.2 /100 | #118 | Exceptional 8.6% |
Demographics Similar to Cubans by Unemployment Among Women with Children Ages 6 to 17 years
In terms of unemployment among women with children ages 6 to 17 years, the demographic groups most similar to Cubans are Immigrants from Peru (9.2%, a difference of 0.010%), Salvadoran (9.2%, a difference of 0.010%), Finnish (9.2%, a difference of 0.10%), Immigrants from Cuba (9.2%, a difference of 0.15%), and Immigrants from North America (9.2%, a difference of 0.20%).
| Demographics | Rating | Rank | Unemployment Among Women with Children Ages 6 to 17 years |
| Trinidadians and Tobagonians | 18.2 /100 | #200 | Poor 9.1% |
| Immigrants | Trinidad and Tobago | 16.7 /100 | #201 | Poor 9.1% |
| Immigrants | Middle Africa | 15.6 /100 | #202 | Poor 9.1% |
| Maltese | 15.3 /100 | #203 | Poor 9.1% |
| Immigrants | Canada | 15.3 /100 | #204 | Poor 9.1% |
| Immigrants | Western Europe | 14.1 /100 | #205 | Poor 9.1% |
| Immigrants | North America | 12.7 /100 | #206 | Poor 9.2% |
| Cubans | 10.9 /100 | #207 | Poor 9.2% |
| Immigrants | Peru | 10.8 /100 | #208 | Poor 9.2% |
| Salvadorans | 10.7 /100 | #209 | Poor 9.2% |
| Finns | 10.0 /100 | #210 | Tragic 9.2% |
| Immigrants | Cuba | 9.6 /100 | #211 | Tragic 9.2% |
| Peruvians | 9.0 /100 | #212 | Tragic 9.2% |
| Spaniards | 8.2 /100 | #213 | Tragic 9.2% |
| Iroquois | 7.5 /100 | #214 | Tragic 9.2% |