French vs Swiss Unemployment Among Women with Children Ages 6 to 17 years
COMPARE
French
Swiss
Unemployment Among Women with Children Ages 6 to 17 years
Unemployment Among Women with Children Ages 6 to 17 years Comparison
French
Swiss
9.7%
UNEMPLOYMENT AMONG WOMEN WITH CHILDREN AGES 6 TO 17 YEARS
0.1/ 100
METRIC RATING
278th/ 347
METRIC RANK
9.0%
UNEMPLOYMENT AMONG WOMEN WITH CHILDREN AGES 6 TO 17 YEARS
33.5/ 100
METRIC RATING
183rd/ 347
METRIC RANK
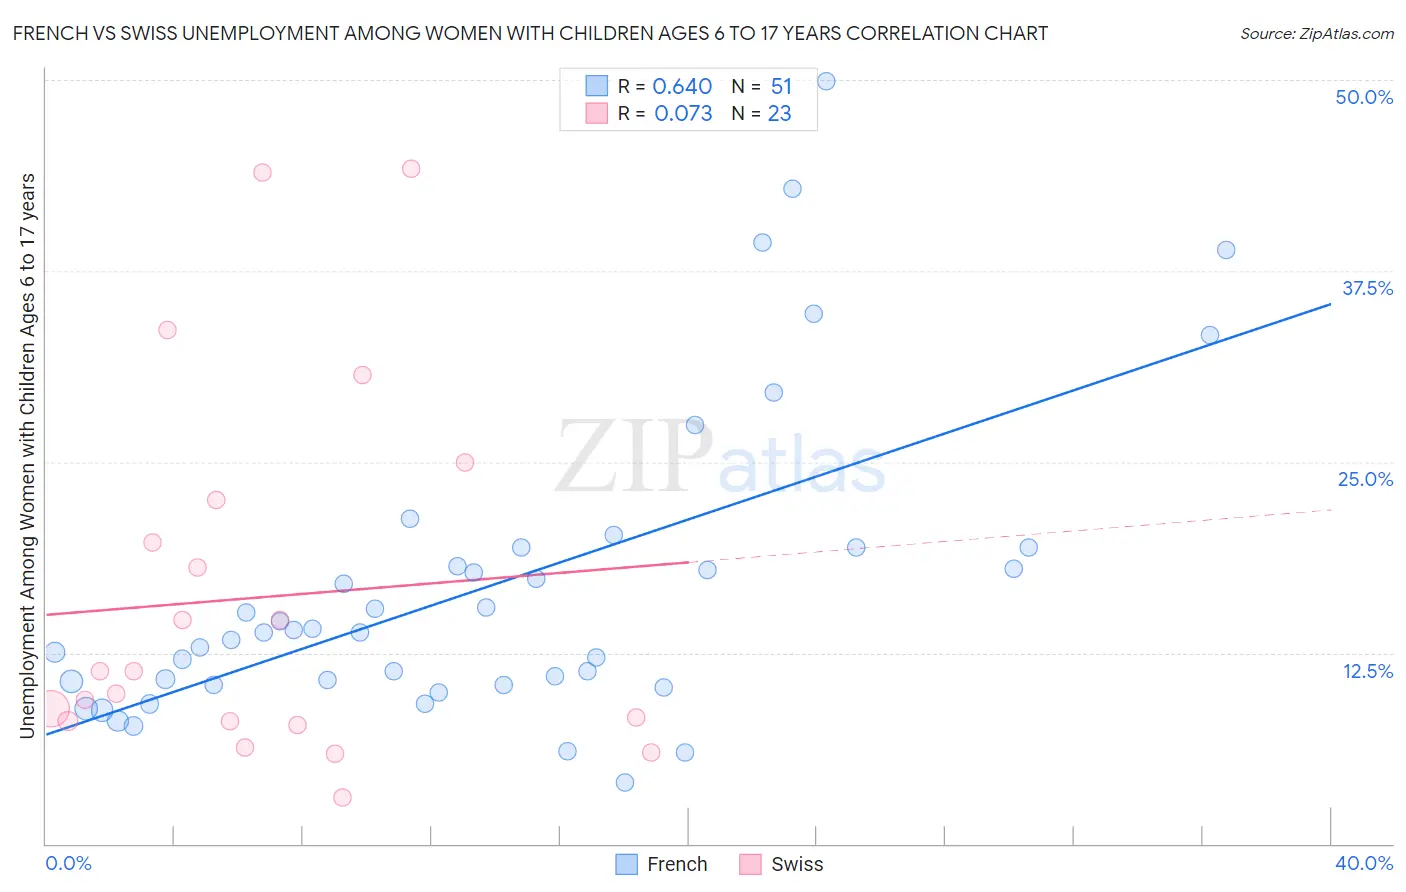
French vs Swiss Unemployment Among Women with Children Ages 6 to 17 years Correlation Chart
The statistical analysis conducted on geographies consisting of 357,857,640 people shows a significant positive correlation between the proportion of French and unemployment rate among women with children between the ages 6 and 17 in the United States with a correlation coefficient (R) of 0.640 and weighted average of 9.7%. Similarly, the statistical analysis conducted on geographies consisting of 308,367,894 people shows a slight positive correlation between the proportion of Swiss and unemployment rate among women with children between the ages 6 and 17 in the United States with a correlation coefficient (R) of 0.073 and weighted average of 9.0%, a difference of 7.3%.
Unemployment Among Women with Children Ages 6 to 17 years Correlation Summary
| Measurement | French | Swiss |
| Minimum | 4.0% | 3.0% |
| Maximum | 49.9% | 44.2% |
| Range | 45.9% | 41.2% |
| Mean | 16.8% | 16.1% |
| Median | 13.8% | 11.3% |
| Interquartile 25% (IQ1) | 10.4% | 8.0% |
| Interquartile 75% (IQ3) | 19.4% | 22.5% |
| Interquartile Range (IQR) | 9.0% | 14.5% |
| Standard Deviation (Sample) | 10.0% | 12.0% |
| Standard Deviation (Population) | 9.9% | 11.7% |
Similar Demographics by Unemployment Among Women with Children Ages 6 to 17 years
Demographics Similar to French by Unemployment Among Women with Children Ages 6 to 17 years
In terms of unemployment among women with children ages 6 to 17 years, the demographic groups most similar to French are Scotch-Irish (9.7%, a difference of 0.030%), British West Indian (9.7%, a difference of 0.070%), Immigrants from Portugal (9.7%, a difference of 0.12%), U.S. Virgin Islander (9.7%, a difference of 0.13%), and Seminole (9.7%, a difference of 0.22%).
| Demographics | Rating | Rank | Unemployment Among Women with Children Ages 6 to 17 years |
| Immigrants | Latin America | 0.1 /100 | #271 | Tragic 9.6% |
| Kiowa | 0.1 /100 | #272 | Tragic 9.6% |
| Whites/Caucasians | 0.1 /100 | #273 | Tragic 9.6% |
| Aleuts | 0.1 /100 | #274 | Tragic 9.6% |
| U.S. Virgin Islanders | 0.1 /100 | #275 | Tragic 9.7% |
| Immigrants | Portugal | 0.1 /100 | #276 | Tragic 9.7% |
| British West Indians | 0.1 /100 | #277 | Tragic 9.7% |
| French | 0.1 /100 | #278 | Tragic 9.7% |
| Scotch-Irish | 0.1 /100 | #279 | Tragic 9.7% |
| Seminole | 0.1 /100 | #280 | Tragic 9.7% |
| Jamaicans | 0.0 /100 | #281 | Tragic 9.8% |
| Slovaks | 0.0 /100 | #282 | Tragic 9.8% |
| Central American Indians | 0.0 /100 | #283 | Tragic 9.9% |
| Yakama | 0.0 /100 | #284 | Tragic 9.9% |
| Hispanics or Latinos | 0.0 /100 | #285 | Tragic 9.9% |
Demographics Similar to Swiss by Unemployment Among Women with Children Ages 6 to 17 years
In terms of unemployment among women with children ages 6 to 17 years, the demographic groups most similar to Swiss are Palestinian (9.0%, a difference of 0.0%), Immigrants from Czechoslovakia (9.0%, a difference of 0.050%), South American Indian (9.0%, a difference of 0.050%), Immigrants from Congo (9.0%, a difference of 0.050%), and Immigrants from Spain (9.0%, a difference of 0.050%).
| Demographics | Rating | Rank | Unemployment Among Women with Children Ages 6 to 17 years |
| Immigrants | Italy | 43.7 /100 | #176 | Average 9.0% |
| Immigrants | Jordan | 41.6 /100 | #177 | Average 9.0% |
| Menominee | 39.3 /100 | #178 | Fair 9.0% |
| Immigrants | Zaire | 38.3 /100 | #179 | Fair 9.0% |
| Ethiopians | 37.6 /100 | #180 | Fair 9.0% |
| Immigrants | Czechoslovakia | 34.5 /100 | #181 | Fair 9.0% |
| South American Indians | 34.4 /100 | #182 | Fair 9.0% |
| Swiss | 33.5 /100 | #183 | Fair 9.0% |
| Palestinians | 33.4 /100 | #184 | Fair 9.0% |
| Immigrants | Congo | 32.5 /100 | #185 | Fair 9.0% |
| Immigrants | Spain | 32.4 /100 | #186 | Fair 9.0% |
| Comanche | 30.0 /100 | #187 | Fair 9.0% |
| Immigrants | Syria | 29.7 /100 | #188 | Fair 9.1% |
| Immigrants | Immigrants | 29.2 /100 | #189 | Fair 9.1% |
| Slovenes | 28.5 /100 | #190 | Fair 9.1% |