Immigrants from Trinidad and Tobago vs Swiss Unemployment Among Women with Children Ages 6 to 17 years
COMPARE
Immigrants from Trinidad and Tobago
Swiss
Unemployment Among Women with Children Ages 6 to 17 years
Unemployment Among Women with Children Ages 6 to 17 years Comparison
Immigrants from Trinidad and Tobago
Swiss
9.1%
UNEMPLOYMENT AMONG WOMEN WITH CHILDREN AGES 6 TO 17 YEARS
16.7/ 100
METRIC RATING
201st/ 347
METRIC RANK
9.0%
UNEMPLOYMENT AMONG WOMEN WITH CHILDREN AGES 6 TO 17 YEARS
33.5/ 100
METRIC RATING
183rd/ 347
METRIC RANK
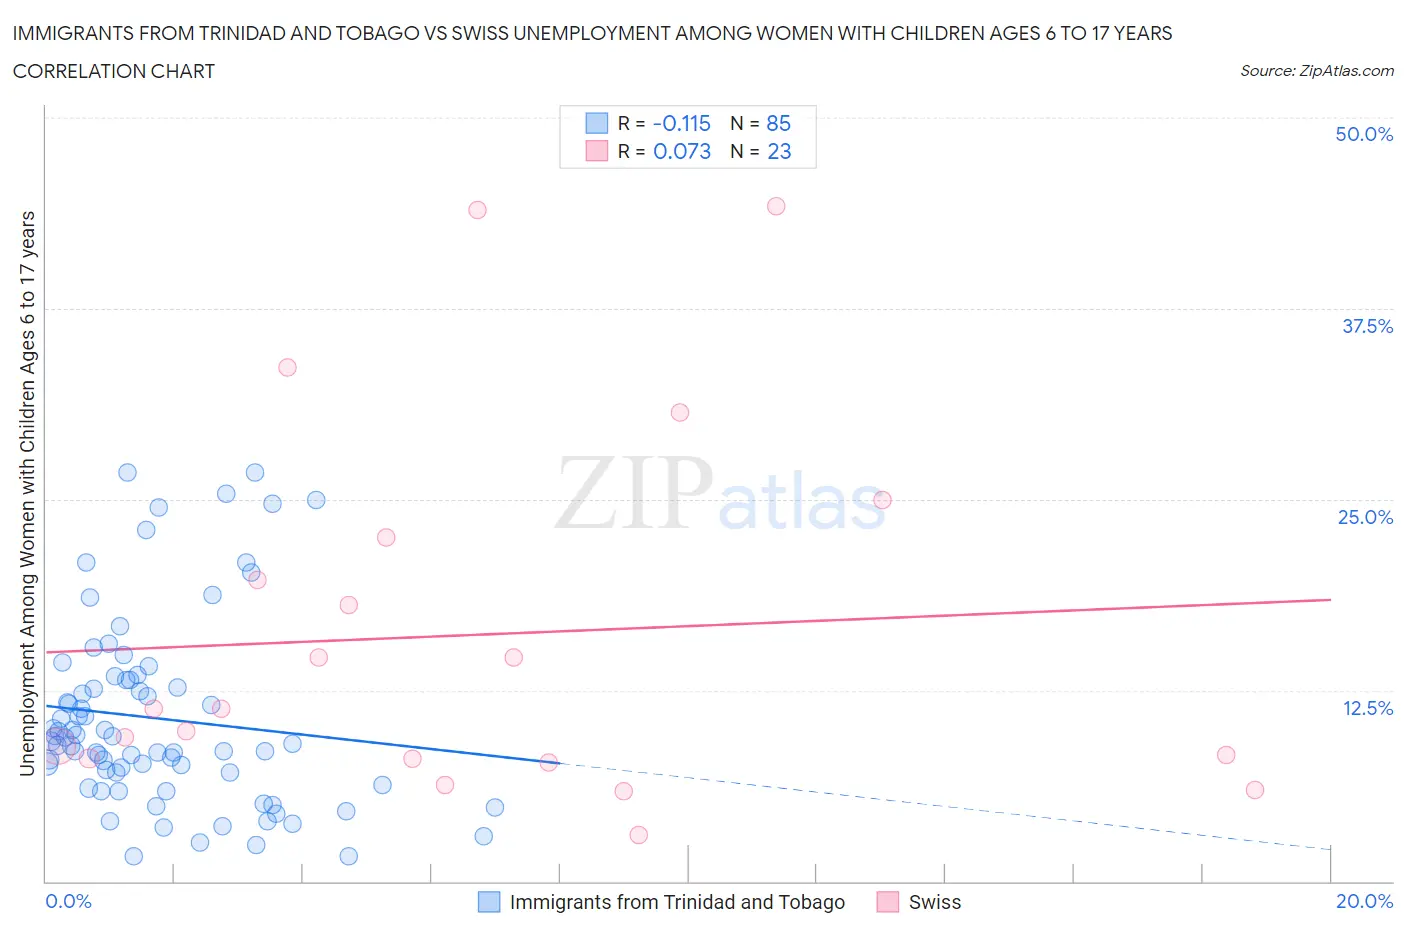
Immigrants from Trinidad and Tobago vs Swiss Unemployment Among Women with Children Ages 6 to 17 years Correlation Chart
The statistical analysis conducted on geographies consisting of 179,476,892 people shows a poor negative correlation between the proportion of Immigrants from Trinidad and Tobago and unemployment rate among women with children between the ages 6 and 17 in the United States with a correlation coefficient (R) of -0.115 and weighted average of 9.1%. Similarly, the statistical analysis conducted on geographies consisting of 308,367,894 people shows a slight positive correlation between the proportion of Swiss and unemployment rate among women with children between the ages 6 and 17 in the United States with a correlation coefficient (R) of 0.073 and weighted average of 9.0%, a difference of 1.0%.
Unemployment Among Women with Children Ages 6 to 17 years Correlation Summary
| Measurement | Immigrants from Trinidad and Tobago | Swiss |
| Minimum | 1.6% | 3.0% |
| Maximum | 26.8% | 44.2% |
| Range | 25.2% | 41.2% |
| Mean | 10.7% | 16.1% |
| Median | 9.1% | 11.3% |
| Interquartile 25% (IQ1) | 6.7% | 8.0% |
| Interquartile 75% (IQ3) | 13.2% | 22.5% |
| Interquartile Range (IQR) | 6.5% | 14.5% |
| Standard Deviation (Sample) | 6.1% | 12.0% |
| Standard Deviation (Population) | 6.1% | 11.7% |
Demographics Similar to Immigrants from Trinidad and Tobago and Swiss by Unemployment Among Women with Children Ages 6 to 17 years
In terms of unemployment among women with children ages 6 to 17 years, the demographic groups most similar to Immigrants from Trinidad and Tobago are Immigrants from Middle Africa (9.1%, a difference of 0.090%), Trinidadian and Tobagonian (9.1%, a difference of 0.11%), Czechoslovakian (9.1%, a difference of 0.29%), Guyanese (9.1%, a difference of 0.36%), and Immigrants from Panama (9.1%, a difference of 0.51%). Similarly, the demographic groups most similar to Swiss are Palestinian (9.0%, a difference of 0.0%), South American Indian (9.0%, a difference of 0.050%), Immigrants from Congo (9.0%, a difference of 0.050%), Immigrants from Spain (9.0%, a difference of 0.050%), and Comanche (9.0%, a difference of 0.17%).
| Demographics | Rating | Rank | Unemployment Among Women with Children Ages 6 to 17 years |
| South American Indians | 34.4 /100 | #182 | Fair 9.0% |
| Swiss | 33.5 /100 | #183 | Fair 9.0% |
| Palestinians | 33.4 /100 | #184 | Fair 9.0% |
| Immigrants | Congo | 32.5 /100 | #185 | Fair 9.0% |
| Immigrants | Spain | 32.4 /100 | #186 | Fair 9.0% |
| Comanche | 30.0 /100 | #187 | Fair 9.0% |
| Immigrants | Syria | 29.7 /100 | #188 | Fair 9.1% |
| Immigrants | Immigrants | 29.2 /100 | #189 | Fair 9.1% |
| Slovenes | 28.5 /100 | #190 | Fair 9.1% |
| Belizeans | 28.4 /100 | #191 | Fair 9.1% |
| Guamanians/Chamorros | 27.2 /100 | #192 | Fair 9.1% |
| Immigrants | Turkey | 25.8 /100 | #193 | Fair 9.1% |
| Immigrants | Kazakhstan | 25.3 /100 | #194 | Fair 9.1% |
| Austrians | 25.0 /100 | #195 | Fair 9.1% |
| Brazilians | 24.4 /100 | #196 | Fair 9.1% |
| Immigrants | Panama | 24.3 /100 | #197 | Fair 9.1% |
| Guyanese | 21.8 /100 | #198 | Fair 9.1% |
| Czechoslovakians | 20.8 /100 | #199 | Fair 9.1% |
| Trinidadians and Tobagonians | 18.2 /100 | #200 | Poor 9.1% |
| Immigrants | Trinidad and Tobago | 16.7 /100 | #201 | Poor 9.1% |
| Immigrants | Middle Africa | 15.6 /100 | #202 | Poor 9.1% |