French vs Immigrants from Netherlands Unemployment Among Women with Children Under 6 years
COMPARE
French
Immigrants from Netherlands
Unemployment Among Women with Children Under 6 years
Unemployment Among Women with Children Under 6 years Comparison
French
Immigrants from Netherlands
8.2%
UNEMPLOYMENT AMONG WOMEN WITH CHILDREN UNDER 6 YEARS
1.7/ 100
METRIC RATING
244th/ 347
METRIC RANK
7.0%
UNEMPLOYMENT AMONG WOMEN WITH CHILDREN UNDER 6 YEARS
99.5/ 100
METRIC RATING
67th/ 347
METRIC RANK
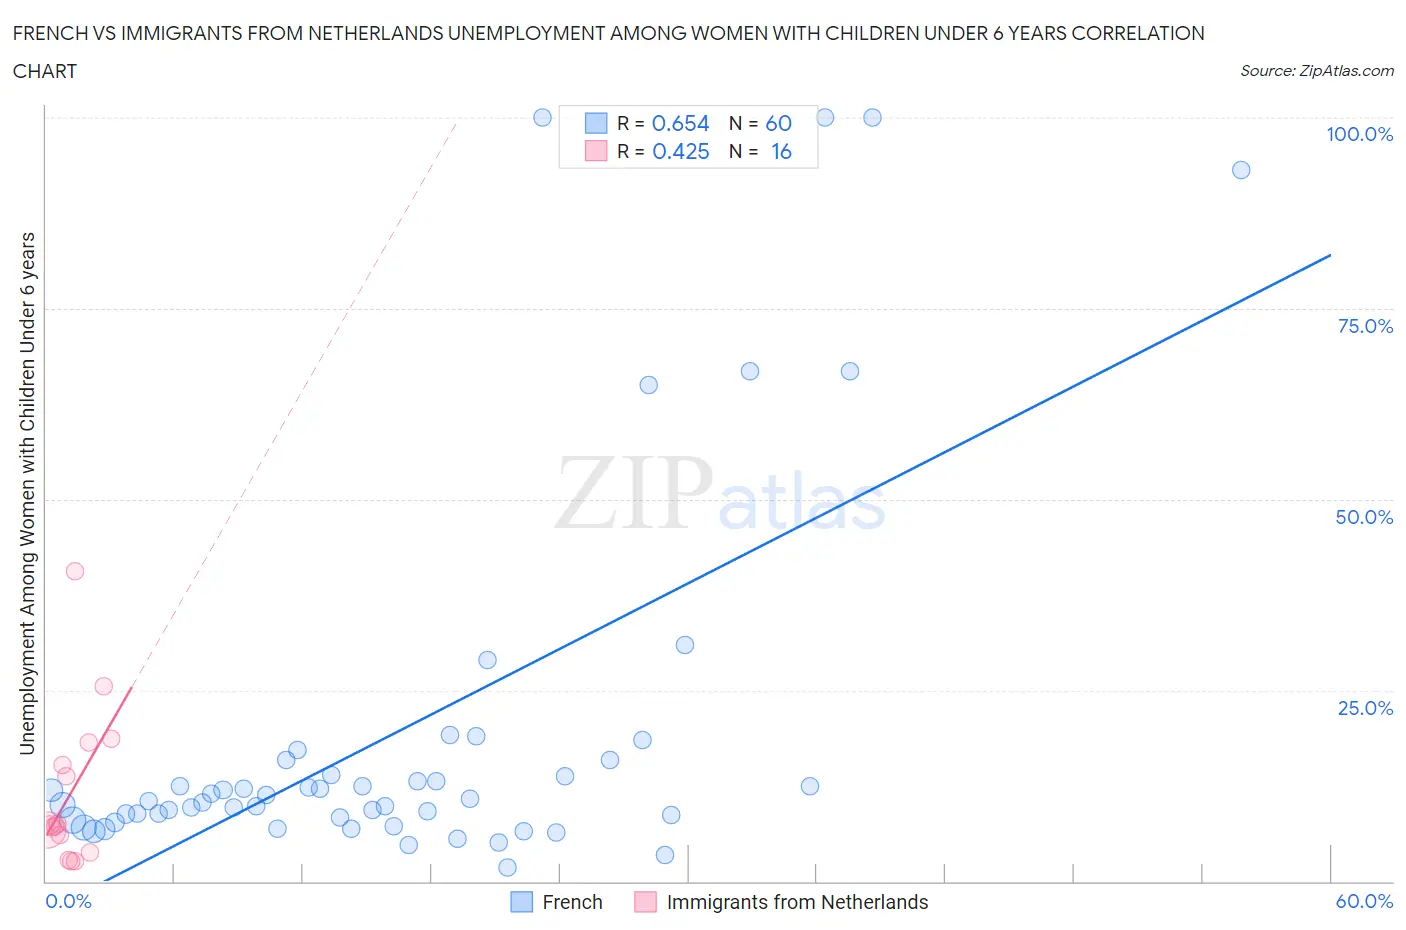
French vs Immigrants from Netherlands Unemployment Among Women with Children Under 6 years Correlation Chart
The statistical analysis conducted on geographies consisting of 377,570,296 people shows a significant positive correlation between the proportion of French and unemployment rate among women with children under the age of 6 in the United States with a correlation coefficient (R) of 0.654 and weighted average of 8.2%. Similarly, the statistical analysis conducted on geographies consisting of 192,009,733 people shows a moderate positive correlation between the proportion of Immigrants from Netherlands and unemployment rate among women with children under the age of 6 in the United States with a correlation coefficient (R) of 0.425 and weighted average of 7.0%, a difference of 17.0%.
Unemployment Among Women with Children Under 6 years Correlation Summary
| Measurement | French | Immigrants from Netherlands |
| Minimum | 1.8% | 2.7% |
| Maximum | 100.0% | 40.6% |
| Range | 98.2% | 37.9% |
| Mean | 19.6% | 11.6% |
| Median | 10.7% | 7.2% |
| Interquartile 25% (IQ1) | 8.1% | 4.9% |
| Interquartile 75% (IQ3) | 14.9% | 16.7% |
| Interquartile Range (IQR) | 6.8% | 11.8% |
| Standard Deviation (Sample) | 24.9% | 10.2% |
| Standard Deviation (Population) | 24.7% | 9.9% |
Similar Demographics by Unemployment Among Women with Children Under 6 years
Demographics Similar to French by Unemployment Among Women with Children Under 6 years
In terms of unemployment among women with children under 6 years, the demographic groups most similar to French are Native Hawaiian (8.2%, a difference of 0.010%), Hawaiian (8.2%, a difference of 0.030%), Central American (8.2%, a difference of 0.34%), Dutch (8.1%, a difference of 0.59%), and German Russian (8.2%, a difference of 0.61%).
| Demographics | Rating | Rank | Unemployment Among Women with Children Under 6 years |
| Immigrants | Costa Rica | 4.1 /100 | #237 | Tragic 8.0% |
| Immigrants | Middle Africa | 3.2 /100 | #238 | Tragic 8.1% |
| Irish | 2.7 /100 | #239 | Tragic 8.1% |
| Immigrants | El Salvador | 2.6 /100 | #240 | Tragic 8.1% |
| Liberians | 2.6 /100 | #241 | Tragic 8.1% |
| Dutch | 2.5 /100 | #242 | Tragic 8.1% |
| Hawaiians | 1.8 /100 | #243 | Tragic 8.2% |
| French | 1.7 /100 | #244 | Tragic 8.2% |
| Native Hawaiians | 1.7 /100 | #245 | Tragic 8.2% |
| Central Americans | 1.4 /100 | #246 | Tragic 8.2% |
| German Russians | 1.2 /100 | #247 | Tragic 8.2% |
| Immigrants | Western Africa | 1.1 /100 | #248 | Tragic 8.2% |
| Immigrants | Sierra Leone | 1.1 /100 | #249 | Tragic 8.2% |
| Nigerians | 1.1 /100 | #250 | Tragic 8.2% |
| Guyanese | 1.0 /100 | #251 | Tragic 8.2% |
Demographics Similar to Immigrants from Netherlands by Unemployment Among Women with Children Under 6 years
In terms of unemployment among women with children under 6 years, the demographic groups most similar to Immigrants from Netherlands are Paraguayan (7.0%, a difference of 0.22%), Immigrants from Eritrea (7.0%, a difference of 0.26%), Immigrants from Iraq (7.0%, a difference of 0.27%), Afghan (7.0%, a difference of 0.30%), and Cuban (7.0%, a difference of 0.40%).
| Demographics | Rating | Rank | Unemployment Among Women with Children Under 6 years |
| Immigrants | Sri Lanka | 99.8 /100 | #60 | Exceptional 6.9% |
| Immigrants | France | 99.7 /100 | #61 | Exceptional 6.9% |
| Somalis | 99.7 /100 | #62 | Exceptional 6.9% |
| Maltese | 99.7 /100 | #63 | Exceptional 6.9% |
| Tongans | 99.7 /100 | #64 | Exceptional 6.9% |
| Immigrants | Kuwait | 99.7 /100 | #65 | Exceptional 6.9% |
| Immigrants | Belgium | 99.6 /100 | #66 | Exceptional 6.9% |
| Immigrants | Netherlands | 99.5 /100 | #67 | Exceptional 7.0% |
| Paraguayans | 99.4 /100 | #68 | Exceptional 7.0% |
| Immigrants | Eritrea | 99.4 /100 | #69 | Exceptional 7.0% |
| Immigrants | Iraq | 99.4 /100 | #70 | Exceptional 7.0% |
| Afghans | 99.4 /100 | #71 | Exceptional 7.0% |
| Cubans | 99.4 /100 | #72 | Exceptional 7.0% |
| Immigrants | Czechoslovakia | 99.2 /100 | #73 | Exceptional 7.0% |
| Turks | 99.2 /100 | #74 | Exceptional 7.0% |