French Canadian vs Potawatomi Unemployment Among Ages 35 to 44 years
COMPARE
French Canadian
Potawatomi
Unemployment Among Ages 35 to 44 years
Unemployment Among Ages 35 to 44 years Comparison
French Canadians
Potawatomi
4.8%
UNEMPLOYMENT AMONG AGES 35 TO 44 YEARS
16.5/ 100
METRIC RATING
208th/ 347
METRIC RANK
5.0%
UNEMPLOYMENT AMONG AGES 35 TO 44 YEARS
2.5/ 100
METRIC RATING
226th/ 347
METRIC RANK
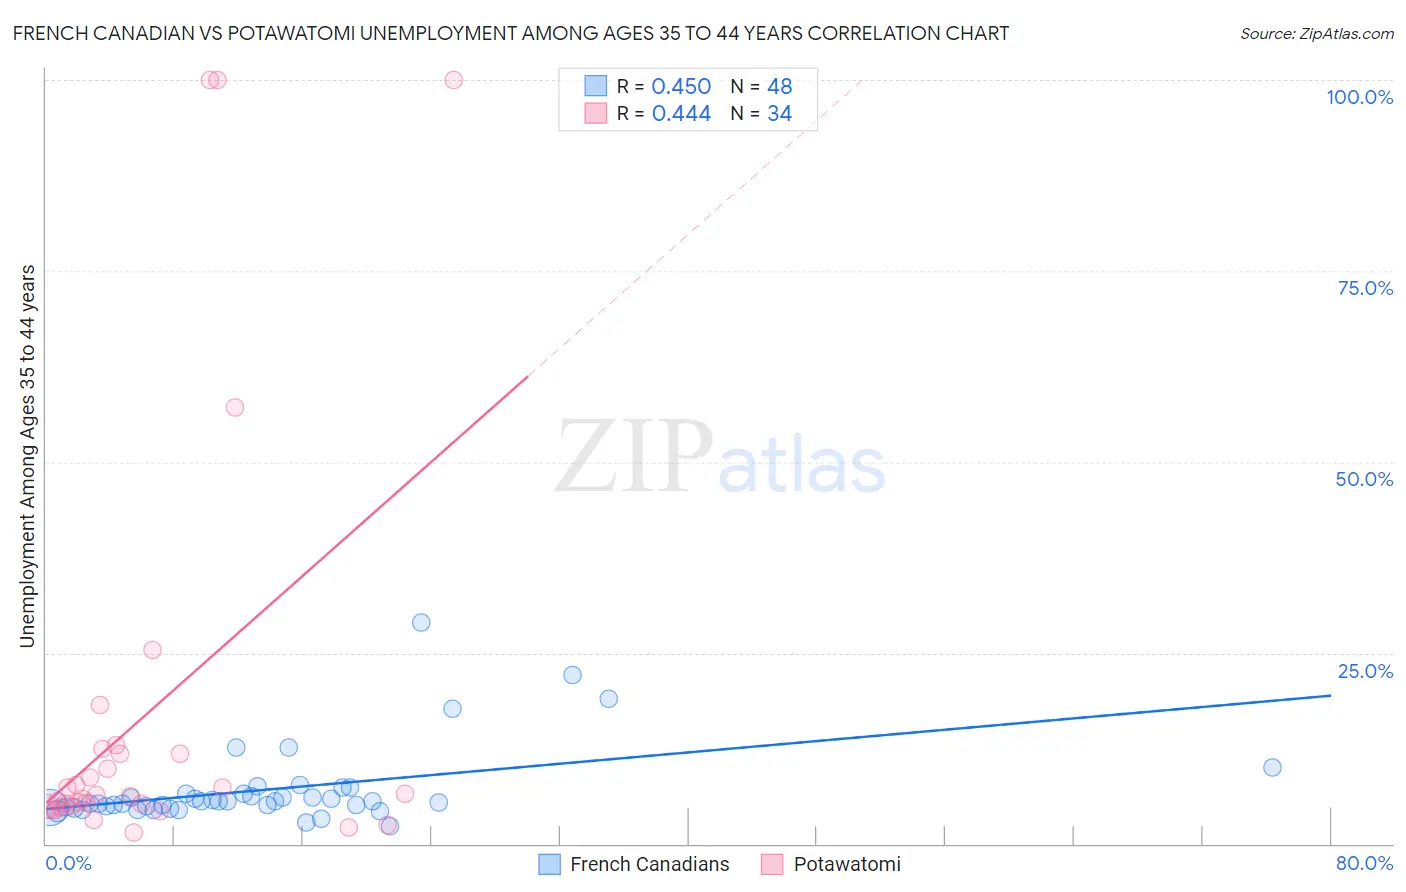
French Canadian vs Potawatomi Unemployment Among Ages 35 to 44 years Correlation Chart
The statistical analysis conducted on geographies consisting of 478,615,928 people shows a moderate positive correlation between the proportion of French Canadians and unemployment rate among population between the ages 35 and 44 in the United States with a correlation coefficient (R) of 0.450 and weighted average of 4.8%. Similarly, the statistical analysis conducted on geographies consisting of 116,262,555 people shows a moderate positive correlation between the proportion of Potawatomi and unemployment rate among population between the ages 35 and 44 in the United States with a correlation coefficient (R) of 0.444 and weighted average of 5.0%, a difference of 3.5%.
Unemployment Among Ages 35 to 44 years Correlation Summary
| Measurement | French Canadian | Potawatomi |
| Minimum | 2.3% | 1.5% |
| Maximum | 29.0% | 100.0% |
| Range | 26.7% | 98.5% |
| Mean | 7.1% | 17.0% |
| Median | 5.5% | 6.3% |
| Interquartile 25% (IQ1) | 4.7% | 4.9% |
| Interquartile 75% (IQ3) | 6.6% | 11.8% |
| Interquartile Range (IQR) | 1.8% | 6.9% |
| Standard Deviation (Sample) | 5.1% | 27.9% |
| Standard Deviation (Population) | 5.0% | 27.5% |
Demographics Similar to French Canadians and Potawatomi by Unemployment Among Ages 35 to 44 years
In terms of unemployment among ages 35 to 44 years, the demographic groups most similar to French Canadians are Immigrants from Western Asia (4.8%, a difference of 0.020%), Immigrants from Uruguay (4.9%, a difference of 0.71%), Immigrants from Cameroon (4.9%, a difference of 0.74%), Nonimmigrants (4.9%, a difference of 1.1%), and Fijian (4.9%, a difference of 1.3%). Similarly, the demographic groups most similar to Potawatomi are Immigrants from Lebanon (5.0%, a difference of 0.12%), Panamanian (5.0%, a difference of 0.23%), Immigrants from Panama (5.0%, a difference of 0.46%), Immigrants from Uzbekistan (5.0%, a difference of 0.47%), and Hmong (5.0%, a difference of 0.54%).
| Demographics | Rating | Rank | Unemployment Among Ages 35 to 44 years |
| Immigrants | Western Asia | 16.6 /100 | #207 | Poor 4.8% |
| French Canadians | 16.5 /100 | #208 | Poor 4.8% |
| Immigrants | Uruguay | 11.5 /100 | #209 | Poor 4.9% |
| Immigrants | Cameroon | 11.4 /100 | #210 | Poor 4.9% |
| Immigrants | Nonimmigrants | 9.4 /100 | #211 | Tragic 4.9% |
| Fijians | 8.7 /100 | #212 | Tragic 4.9% |
| Osage | 8.6 /100 | #213 | Tragic 4.9% |
| Immigrants | Africa | 8.2 /100 | #214 | Tragic 4.9% |
| Immigrants | Immigrants | 8.0 /100 | #215 | Tragic 4.9% |
| Americans | 6.2 /100 | #216 | Tragic 4.9% |
| Moroccans | 6.0 /100 | #217 | Tragic 4.9% |
| Chickasaw | 5.7 /100 | #218 | Tragic 4.9% |
| Sierra Leoneans | 4.8 /100 | #219 | Tragic 4.9% |
| Immigrants | Sierra Leone | 4.7 /100 | #220 | Tragic 4.9% |
| Bermudans | 3.9 /100 | #221 | Tragic 5.0% |
| Hmong | 3.5 /100 | #222 | Tragic 5.0% |
| Immigrants | Panama | 3.3 /100 | #223 | Tragic 5.0% |
| Panamanians | 2.9 /100 | #224 | Tragic 5.0% |
| Immigrants | Lebanon | 2.7 /100 | #225 | Tragic 5.0% |
| Potawatomi | 2.5 /100 | #226 | Tragic 5.0% |
| Immigrants | Uzbekistan | 1.9 /100 | #227 | Tragic 5.0% |