French Canadian vs Senegalese Unemployment Among Ages 35 to 44 years
COMPARE
French Canadian
Senegalese
Unemployment Among Ages 35 to 44 years
Unemployment Among Ages 35 to 44 years Comparison
French Canadians
Senegalese
4.8%
UNEMPLOYMENT AMONG AGES 35 TO 44 YEARS
16.5/ 100
METRIC RATING
208th/ 347
METRIC RANK
5.3%
UNEMPLOYMENT AMONG AGES 35 TO 44 YEARS
0.0/ 100
METRIC RATING
272nd/ 347
METRIC RANK
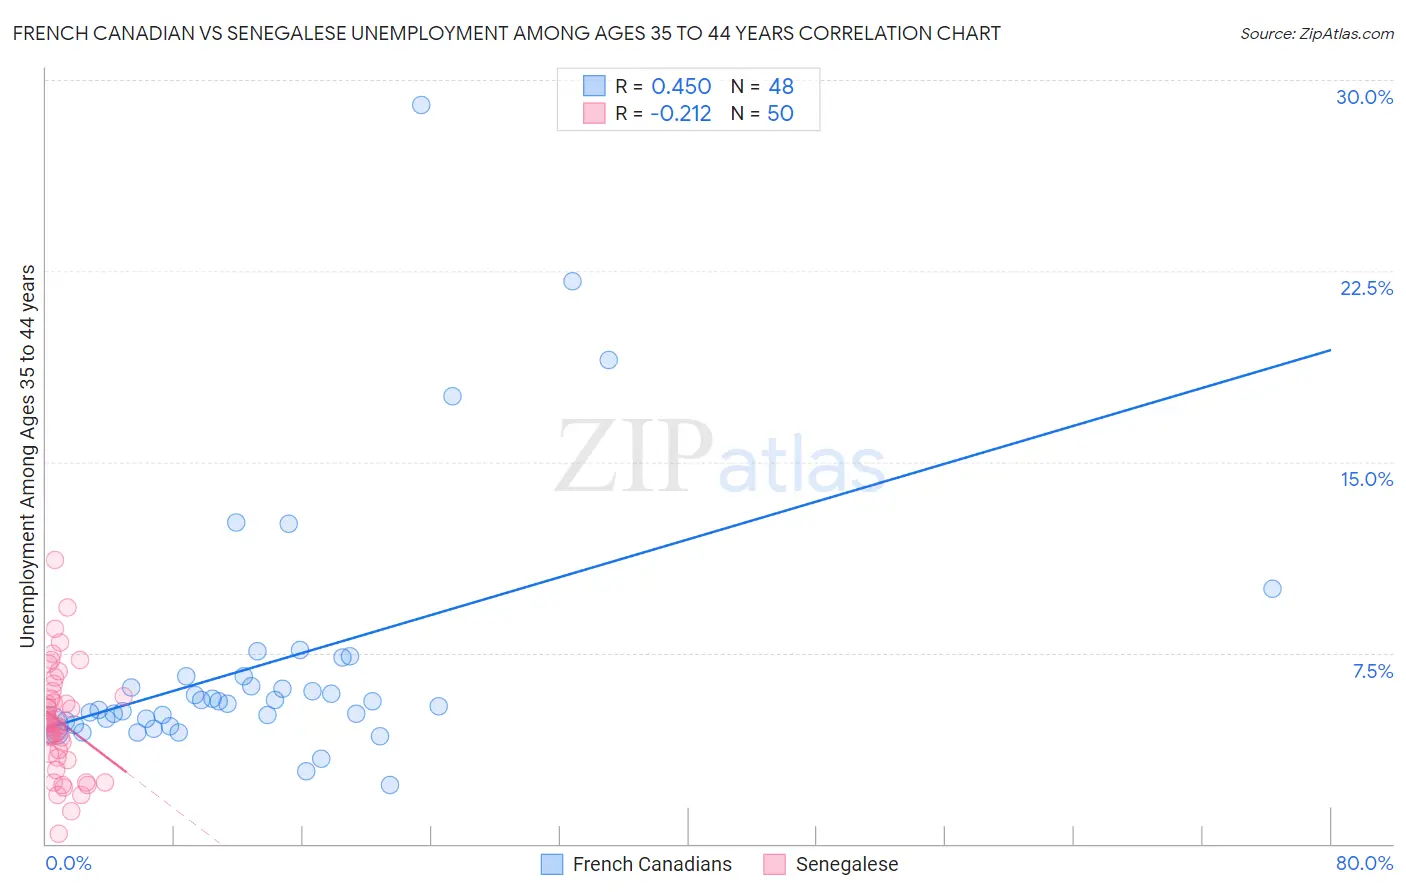
French Canadian vs Senegalese Unemployment Among Ages 35 to 44 years Correlation Chart
The statistical analysis conducted on geographies consisting of 478,615,928 people shows a moderate positive correlation between the proportion of French Canadians and unemployment rate among population between the ages 35 and 44 in the United States with a correlation coefficient (R) of 0.450 and weighted average of 4.8%. Similarly, the statistical analysis conducted on geographies consisting of 77,874,000 people shows a weak negative correlation between the proportion of Senegalese and unemployment rate among population between the ages 35 and 44 in the United States with a correlation coefficient (R) of -0.212 and weighted average of 5.3%, a difference of 10.8%.
Unemployment Among Ages 35 to 44 years Correlation Summary
| Measurement | French Canadian | Senegalese |
| Minimum | 2.3% | 0.40% |
| Maximum | 29.0% | 11.1% |
| Range | 26.7% | 10.7% |
| Mean | 7.1% | 4.8% |
| Median | 5.5% | 4.7% |
| Interquartile 25% (IQ1) | 4.7% | 3.4% |
| Interquartile 75% (IQ3) | 6.6% | 5.8% |
| Interquartile Range (IQR) | 1.8% | 2.4% |
| Standard Deviation (Sample) | 5.1% | 2.1% |
| Standard Deviation (Population) | 5.0% | 2.1% |
Similar Demographics by Unemployment Among Ages 35 to 44 years
Demographics Similar to French Canadians by Unemployment Among Ages 35 to 44 years
In terms of unemployment among ages 35 to 44 years, the demographic groups most similar to French Canadians are Immigrants from Western Asia (4.8%, a difference of 0.020%), Soviet Union (4.8%, a difference of 0.23%), Spaniard (4.8%, a difference of 0.27%), Immigrants from Philippines (4.8%, a difference of 0.39%), and Uruguayan (4.8%, a difference of 0.41%).
| Demographics | Rating | Rank | Unemployment Among Ages 35 to 44 years |
| Ugandans | 21.4 /100 | #201 | Fair 4.8% |
| Immigrants | Afghanistan | 20.2 /100 | #202 | Fair 4.8% |
| Uruguayans | 20.0 /100 | #203 | Fair 4.8% |
| Immigrants | Philippines | 19.8 /100 | #204 | Poor 4.8% |
| Spaniards | 18.7 /100 | #205 | Poor 4.8% |
| Soviet Union | 18.4 /100 | #206 | Poor 4.8% |
| Immigrants | Western Asia | 16.6 /100 | #207 | Poor 4.8% |
| French Canadians | 16.5 /100 | #208 | Poor 4.8% |
| Immigrants | Uruguay | 11.5 /100 | #209 | Poor 4.9% |
| Immigrants | Cameroon | 11.4 /100 | #210 | Poor 4.9% |
| Immigrants | Nonimmigrants | 9.4 /100 | #211 | Tragic 4.9% |
| Fijians | 8.7 /100 | #212 | Tragic 4.9% |
| Osage | 8.6 /100 | #213 | Tragic 4.9% |
| Immigrants | Africa | 8.2 /100 | #214 | Tragic 4.9% |
| Immigrants | Immigrants | 8.0 /100 | #215 | Tragic 4.9% |
Demographics Similar to Senegalese by Unemployment Among Ages 35 to 44 years
In terms of unemployment among ages 35 to 44 years, the demographic groups most similar to Senegalese are Ute (5.3%, a difference of 0.010%), Blackfeet (5.3%, a difference of 0.18%), Vietnamese (5.4%, a difference of 0.18%), Creek (5.4%, a difference of 0.22%), and Immigrants from Mexico (5.4%, a difference of 0.30%).
| Demographics | Rating | Rank | Unemployment Among Ages 35 to 44 years |
| Yaqui | 0.1 /100 | #265 | Tragic 5.3% |
| Immigrants | Bangladesh | 0.1 /100 | #266 | Tragic 5.3% |
| Immigrants | Western Africa | 0.0 /100 | #267 | Tragic 5.3% |
| Hawaiians | 0.0 /100 | #268 | Tragic 5.3% |
| Cajuns | 0.0 /100 | #269 | Tragic 5.3% |
| Blackfeet | 0.0 /100 | #270 | Tragic 5.3% |
| Ute | 0.0 /100 | #271 | Tragic 5.3% |
| Senegalese | 0.0 /100 | #272 | Tragic 5.3% |
| Vietnamese | 0.0 /100 | #273 | Tragic 5.4% |
| Creek | 0.0 /100 | #274 | Tragic 5.4% |
| Immigrants | Mexico | 0.0 /100 | #275 | Tragic 5.4% |
| Native Hawaiians | 0.0 /100 | #276 | Tragic 5.4% |
| Immigrants | Caribbean | 0.0 /100 | #277 | Tragic 5.4% |
| Lumbee | 0.0 /100 | #278 | Tragic 5.4% |
| Immigrants | Senegal | 0.0 /100 | #279 | Tragic 5.4% |