Japanese vs Costa Rican Unemployment Among Women with Children Under 6 years
COMPARE
Japanese
Costa Rican
Unemployment Among Women with Children Under 6 years
Unemployment Among Women with Children Under 6 years Comparison
Japanese
Costa Ricans
7.5%
UNEMPLOYMENT AMONG WOMEN WITH CHILDREN UNDER 6 YEARS
78.9/ 100
METRIC RATING
146th/ 347
METRIC RANK
7.8%
UNEMPLOYMENT AMONG WOMEN WITH CHILDREN UNDER 6 YEARS
17.6/ 100
METRIC RATING
209th/ 347
METRIC RANK
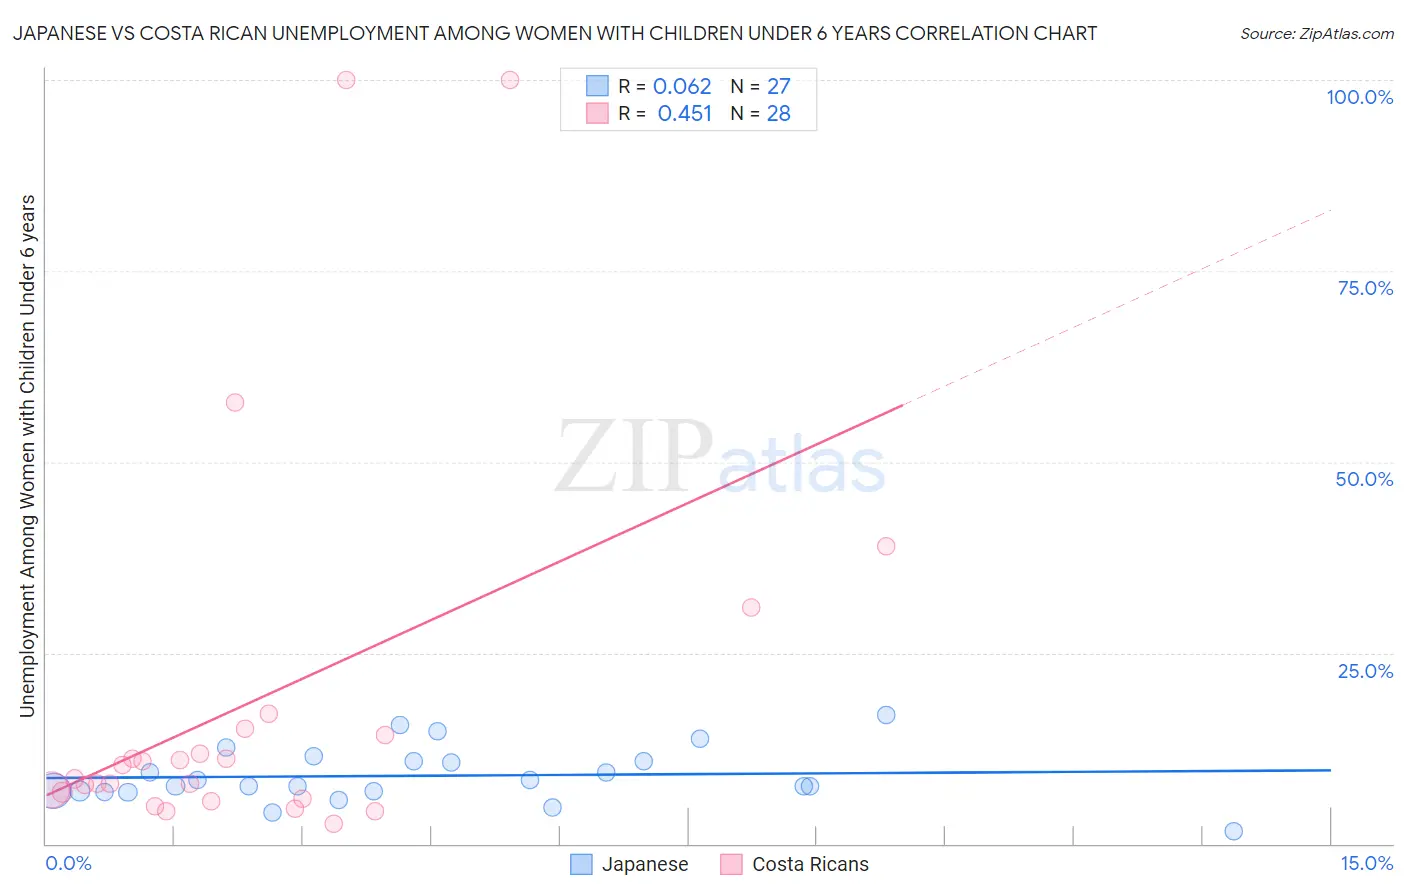
Japanese vs Costa Rican Unemployment Among Women with Children Under 6 years Correlation Chart
The statistical analysis conducted on geographies consisting of 210,271,633 people shows a slight positive correlation between the proportion of Japanese and unemployment rate among women with children under the age of 6 in the United States with a correlation coefficient (R) of 0.062 and weighted average of 7.5%. Similarly, the statistical analysis conducted on geographies consisting of 211,982,760 people shows a moderate positive correlation between the proportion of Costa Ricans and unemployment rate among women with children under the age of 6 in the United States with a correlation coefficient (R) of 0.451 and weighted average of 7.8%, a difference of 4.9%.
Unemployment Among Women with Children Under 6 years Correlation Summary
| Measurement | Japanese | Costa Rican |
| Minimum | 1.7% | 2.6% |
| Maximum | 16.9% | 100.0% |
| Range | 15.2% | 97.4% |
| Mean | 8.9% | 18.8% |
| Median | 7.6% | 9.4% |
| Interquartile 25% (IQ1) | 6.8% | 6.3% |
| Interquartile 75% (IQ3) | 10.8% | 14.7% |
| Interquartile Range (IQR) | 4.0% | 8.4% |
| Standard Deviation (Sample) | 3.6% | 25.8% |
| Standard Deviation (Population) | 3.5% | 25.3% |
Similar Demographics by Unemployment Among Women with Children Under 6 years
Demographics Similar to Japanese by Unemployment Among Women with Children Under 6 years
In terms of unemployment among women with children under 6 years, the demographic groups most similar to Japanese are Immigrants from Jordan (7.5%, a difference of 0.0%), European (7.5%, a difference of 0.030%), Immigrants from Oceania (7.5%, a difference of 0.050%), Immigrants from Brazil (7.5%, a difference of 0.16%), and Korean (7.5%, a difference of 0.26%).
| Demographics | Rating | Rank | Unemployment Among Women with Children Under 6 years |
| Immigrants | Colombia | 83.9 /100 | #139 | Excellent 7.4% |
| Scandinavians | 83.0 /100 | #140 | Excellent 7.4% |
| Greeks | 82.6 /100 | #141 | Excellent 7.4% |
| Immigrants | Argentina | 81.5 /100 | #142 | Excellent 7.5% |
| Koreans | 81.3 /100 | #143 | Excellent 7.5% |
| Europeans | 79.1 /100 | #144 | Good 7.5% |
| Immigrants | Jordan | 78.9 /100 | #145 | Good 7.5% |
| Japanese | 78.9 /100 | #146 | Good 7.5% |
| Immigrants | Oceania | 78.4 /100 | #147 | Good 7.5% |
| Immigrants | Brazil | 77.3 /100 | #148 | Good 7.5% |
| Colombians | 76.1 /100 | #149 | Good 7.5% |
| Aleuts | 76.0 /100 | #150 | Good 7.5% |
| Immigrants | Peru | 74.9 /100 | #151 | Good 7.5% |
| Bangladeshis | 74.8 /100 | #152 | Good 7.5% |
| Uruguayans | 74.7 /100 | #153 | Good 7.5% |
Demographics Similar to Costa Ricans by Unemployment Among Women with Children Under 6 years
In terms of unemployment among women with children under 6 years, the demographic groups most similar to Costa Ricans are Immigrants from Syria (7.8%, a difference of 0.14%), Polish (7.9%, a difference of 0.18%), Immigrants from Ecuador (7.9%, a difference of 0.31%), Canadian (7.8%, a difference of 0.32%), and Hungarian (7.8%, a difference of 0.37%).
| Demographics | Rating | Rank | Unemployment Among Women with Children Under 6 years |
| Sudanese | 23.5 /100 | #202 | Fair 7.8% |
| Spaniards | 23.3 /100 | #203 | Fair 7.8% |
| Lebanese | 22.2 /100 | #204 | Fair 7.8% |
| Immigrants | Immigrants | 21.4 /100 | #205 | Fair 7.8% |
| Hungarians | 21.2 /100 | #206 | Fair 7.8% |
| Canadians | 20.6 /100 | #207 | Fair 7.8% |
| Immigrants | Syria | 18.9 /100 | #208 | Poor 7.8% |
| Costa Ricans | 17.6 /100 | #209 | Poor 7.8% |
| Poles | 16.0 /100 | #210 | Poor 7.9% |
| Immigrants | Ecuador | 14.9 /100 | #211 | Poor 7.9% |
| Swiss | 12.3 /100 | #212 | Poor 7.9% |
| Scottish | 11.4 /100 | #213 | Poor 7.9% |
| Spanish | 11.3 /100 | #214 | Poor 7.9% |
| Ecuadorians | 11.2 /100 | #215 | Poor 7.9% |
| Immigrants | Lebanon | 11.1 /100 | #216 | Poor 7.9% |