Immigrants from Northern Africa vs Costa Rican Unemployment Among Women with Children Under 6 years
COMPARE
Immigrants from Northern Africa
Costa Rican
Unemployment Among Women with Children Under 6 years
Unemployment Among Women with Children Under 6 years Comparison
Immigrants from Northern Africa
Costa Ricans
7.4%
UNEMPLOYMENT AMONG WOMEN WITH CHILDREN UNDER 6 YEARS
85.3/ 100
METRIC RATING
135th/ 347
METRIC RANK
7.8%
UNEMPLOYMENT AMONG WOMEN WITH CHILDREN UNDER 6 YEARS
17.6/ 100
METRIC RATING
209th/ 347
METRIC RANK
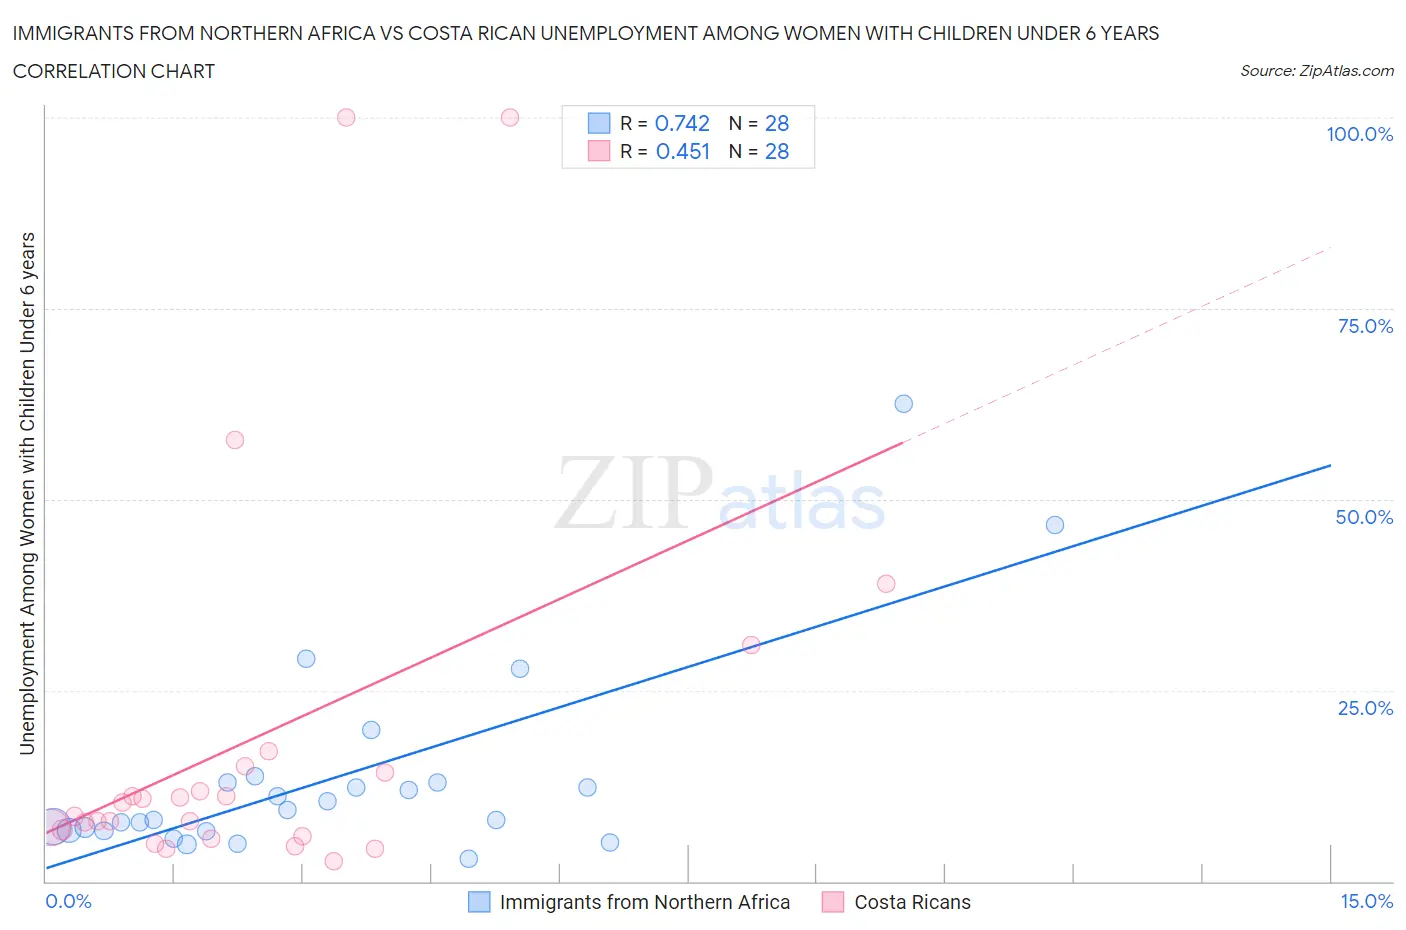
Immigrants from Northern Africa vs Costa Rican Unemployment Among Women with Children Under 6 years Correlation Chart
The statistical analysis conducted on geographies consisting of 256,290,723 people shows a strong positive correlation between the proportion of Immigrants from Northern Africa and unemployment rate among women with children under the age of 6 in the United States with a correlation coefficient (R) of 0.742 and weighted average of 7.4%. Similarly, the statistical analysis conducted on geographies consisting of 211,982,760 people shows a moderate positive correlation between the proportion of Costa Ricans and unemployment rate among women with children under the age of 6 in the United States with a correlation coefficient (R) of 0.451 and weighted average of 7.8%, a difference of 5.6%.
Unemployment Among Women with Children Under 6 years Correlation Summary
| Measurement | Immigrants from Northern Africa | Costa Rican |
| Minimum | 2.9% | 2.6% |
| Maximum | 62.5% | 100.0% |
| Range | 59.6% | 97.4% |
| Mean | 13.6% | 18.8% |
| Median | 8.7% | 9.4% |
| Interquartile 25% (IQ1) | 6.6% | 6.3% |
| Interquartile 75% (IQ3) | 12.9% | 14.7% |
| Interquartile Range (IQR) | 6.3% | 8.4% |
| Standard Deviation (Sample) | 13.3% | 25.8% |
| Standard Deviation (Population) | 13.1% | 25.3% |
Similar Demographics by Unemployment Among Women with Children Under 6 years
Demographics Similar to Immigrants from Northern Africa by Unemployment Among Women with Children Under 6 years
In terms of unemployment among women with children under 6 years, the demographic groups most similar to Immigrants from Northern Africa are Immigrants from Bolivia (7.4%, a difference of 0.060%), Immigrants from Morocco (7.4%, a difference of 0.060%), Immigrants from Cambodia (7.4%, a difference of 0.090%), Immigrants from Uganda (7.4%, a difference of 0.17%), and Immigrants from Norway (7.4%, a difference of 0.17%).
| Demographics | Rating | Rank | Unemployment Among Women with Children Under 6 years |
| Zimbabweans | 91.5 /100 | #128 | Exceptional 7.3% |
| Slovenes | 89.2 /100 | #129 | Excellent 7.4% |
| Swedes | 88.4 /100 | #130 | Excellent 7.4% |
| Ukrainians | 88.2 /100 | #131 | Excellent 7.4% |
| Immigrants | Armenia | 87.4 /100 | #132 | Excellent 7.4% |
| Immigrants | Uganda | 86.5 /100 | #133 | Excellent 7.4% |
| Immigrants | Bolivia | 85.7 /100 | #134 | Excellent 7.4% |
| Immigrants | Northern Africa | 85.3 /100 | #135 | Excellent 7.4% |
| Immigrants | Morocco | 84.9 /100 | #136 | Excellent 7.4% |
| Immigrants | Cambodia | 84.6 /100 | #137 | Excellent 7.4% |
| Immigrants | Norway | 84.1 /100 | #138 | Excellent 7.4% |
| Immigrants | Colombia | 83.9 /100 | #139 | Excellent 7.4% |
| Scandinavians | 83.0 /100 | #140 | Excellent 7.4% |
| Greeks | 82.6 /100 | #141 | Excellent 7.4% |
| Immigrants | Argentina | 81.5 /100 | #142 | Excellent 7.5% |
Demographics Similar to Costa Ricans by Unemployment Among Women with Children Under 6 years
In terms of unemployment among women with children under 6 years, the demographic groups most similar to Costa Ricans are Immigrants from Syria (7.8%, a difference of 0.14%), Polish (7.9%, a difference of 0.18%), Immigrants from Ecuador (7.9%, a difference of 0.31%), Canadian (7.8%, a difference of 0.32%), and Hungarian (7.8%, a difference of 0.37%).
| Demographics | Rating | Rank | Unemployment Among Women with Children Under 6 years |
| Sudanese | 23.5 /100 | #202 | Fair 7.8% |
| Spaniards | 23.3 /100 | #203 | Fair 7.8% |
| Lebanese | 22.2 /100 | #204 | Fair 7.8% |
| Immigrants | Immigrants | 21.4 /100 | #205 | Fair 7.8% |
| Hungarians | 21.2 /100 | #206 | Fair 7.8% |
| Canadians | 20.6 /100 | #207 | Fair 7.8% |
| Immigrants | Syria | 18.9 /100 | #208 | Poor 7.8% |
| Costa Ricans | 17.6 /100 | #209 | Poor 7.8% |
| Poles | 16.0 /100 | #210 | Poor 7.9% |
| Immigrants | Ecuador | 14.9 /100 | #211 | Poor 7.9% |
| Swiss | 12.3 /100 | #212 | Poor 7.9% |
| Scottish | 11.4 /100 | #213 | Poor 7.9% |
| Spanish | 11.3 /100 | #214 | Poor 7.9% |
| Ecuadorians | 11.2 /100 | #215 | Poor 7.9% |
| Immigrants | Lebanon | 11.1 /100 | #216 | Poor 7.9% |