Finnish vs Immigrants from Somalia Unemployment Among Seniors over 65 years
COMPARE
Finnish
Immigrants from Somalia
Unemployment Among Seniors over 65 years
Unemployment Among Seniors over 65 years Comparison
Finns
Immigrants from Somalia
5.0%
UNEMPLOYMENT AMONG SENIORS OVER 65 YEARS
92.2/ 100
METRIC RATING
111th/ 347
METRIC RANK
5.2%
UNEMPLOYMENT AMONG SENIORS OVER 65 YEARS
44.0/ 100
METRIC RATING
179th/ 347
METRIC RANK
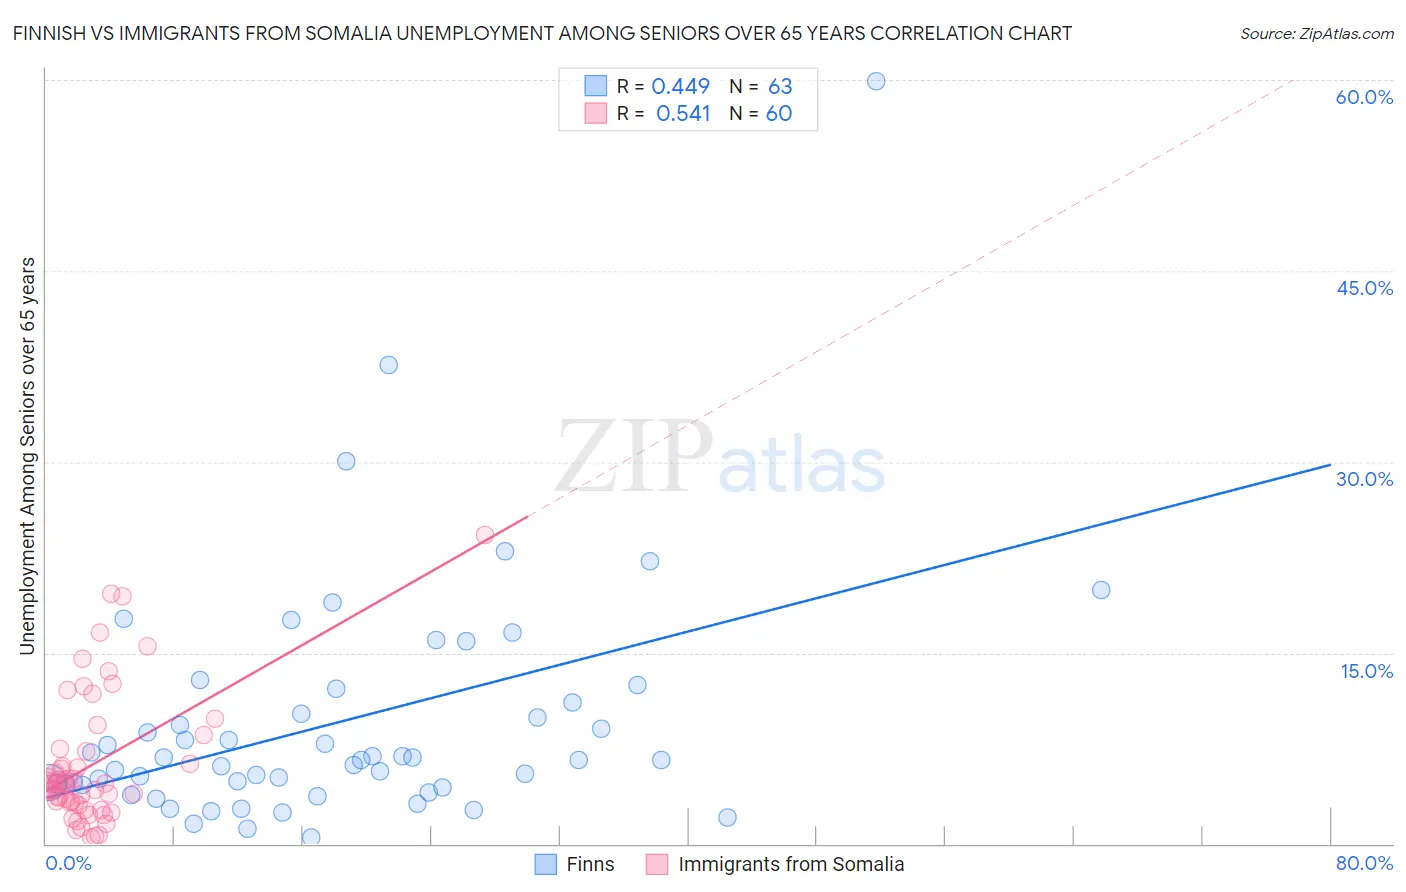
Finnish vs Immigrants from Somalia Unemployment Among Seniors over 65 years Correlation Chart
The statistical analysis conducted on geographies consisting of 356,249,790 people shows a moderate positive correlation between the proportion of Finns and unemployment rate amomg seniors over the age of 65 in the United States with a correlation coefficient (R) of 0.449 and weighted average of 5.0%. Similarly, the statistical analysis conducted on geographies consisting of 88,494,668 people shows a substantial positive correlation between the proportion of Immigrants from Somalia and unemployment rate amomg seniors over the age of 65 in the United States with a correlation coefficient (R) of 0.541 and weighted average of 5.2%, a difference of 2.2%.
Unemployment Among Seniors over 65 years Correlation Summary
| Measurement | Finnish | Immigrants from Somalia |
| Minimum | 0.50% | 0.50% |
| Maximum | 59.9% | 24.3% |
| Range | 59.4% | 23.8% |
| Mean | 9.5% | 6.3% |
| Median | 6.6% | 4.7% |
| Interquartile 25% (IQ1) | 4.6% | 3.2% |
| Interquartile 75% (IQ3) | 11.1% | 7.4% |
| Interquartile Range (IQR) | 6.5% | 4.1% |
| Standard Deviation (Sample) | 9.5% | 5.1% |
| Standard Deviation (Population) | 9.5% | 5.1% |
Similar Demographics by Unemployment Among Seniors over 65 years
Demographics Similar to Finns by Unemployment Among Seniors over 65 years
In terms of unemployment among seniors over 65 years, the demographic groups most similar to Finns are Eastern European (5.0%, a difference of 0.020%), Immigrants from Saudi Arabia (5.0%, a difference of 0.060%), Immigrants from Malaysia (5.0%, a difference of 0.070%), Seminole (5.0%, a difference of 0.080%), and Immigrants from Vietnam (5.0%, a difference of 0.090%).
| Demographics | Rating | Rank | Unemployment Among Seniors over 65 years |
| Immigrants | Scotland | 95.0 /100 | #104 | Exceptional 5.0% |
| Okinawans | 94.7 /100 | #105 | Exceptional 5.0% |
| Immigrants | Turkey | 94.3 /100 | #106 | Exceptional 5.0% |
| Immigrants | Germany | 93.2 /100 | #107 | Exceptional 5.0% |
| Immigrants | Vietnam | 92.9 /100 | #108 | Exceptional 5.0% |
| Immigrants | Malaysia | 92.7 /100 | #109 | Exceptional 5.0% |
| Immigrants | Saudi Arabia | 92.7 /100 | #110 | Exceptional 5.0% |
| Finns | 92.2 /100 | #111 | Exceptional 5.0% |
| Eastern Europeans | 92.0 /100 | #112 | Exceptional 5.0% |
| Seminole | 91.4 /100 | #113 | Exceptional 5.0% |
| Immigrants | Latvia | 91.4 /100 | #114 | Exceptional 5.0% |
| Celtics | 91.3 /100 | #115 | Exceptional 5.0% |
| Immigrants | Korea | 91.0 /100 | #116 | Exceptional 5.0% |
| Malaysians | 90.4 /100 | #117 | Exceptional 5.1% |
| Soviet Union | 90.1 /100 | #118 | Exceptional 5.1% |
Demographics Similar to Immigrants from Somalia by Unemployment Among Seniors over 65 years
In terms of unemployment among seniors over 65 years, the demographic groups most similar to Immigrants from Somalia are Russian (5.2%, a difference of 0.010%), Immigrants from Belgium (5.2%, a difference of 0.020%), Immigrants from Italy (5.2%, a difference of 0.020%), Panamanian (5.2%, a difference of 0.030%), and Icelander (5.2%, a difference of 0.060%).
| Demographics | Rating | Rank | Unemployment Among Seniors over 65 years |
| Immigrants | Ireland | 53.2 /100 | #172 | Average 5.1% |
| Immigrants | Spain | 51.7 /100 | #173 | Average 5.1% |
| Spanish Americans | 50.0 /100 | #174 | Average 5.1% |
| Immigrants | Eastern Europe | 49.8 /100 | #175 | Average 5.1% |
| Indians (Asian) | 46.6 /100 | #176 | Average 5.2% |
| Icelanders | 45.9 /100 | #177 | Average 5.2% |
| Immigrants | Belgium | 44.8 /100 | #178 | Average 5.2% |
| Immigrants | Somalia | 44.0 /100 | #179 | Average 5.2% |
| Russians | 43.6 /100 | #180 | Average 5.2% |
| Immigrants | Italy | 43.5 /100 | #181 | Average 5.2% |
| Panamanians | 43.0 /100 | #182 | Average 5.2% |
| Immigrants | Western Asia | 42.1 /100 | #183 | Average 5.2% |
| Immigrants | Serbia | 41.6 /100 | #184 | Average 5.2% |
| Immigrants | Iran | 36.0 /100 | #185 | Fair 5.2% |
| Americans | 35.1 /100 | #186 | Fair 5.2% |