Finnish vs Immigrants from Uzbekistan Unemployment Among Seniors over 65 years
COMPARE
Finnish
Immigrants from Uzbekistan
Unemployment Among Seniors over 65 years
Unemployment Among Seniors over 65 years Comparison
Finns
Immigrants from Uzbekistan
5.0%
UNEMPLOYMENT AMONG SENIORS OVER 65 YEARS
92.2/ 100
METRIC RATING
111th/ 347
METRIC RANK
5.2%
UNEMPLOYMENT AMONG SENIORS OVER 65 YEARS
10.7/ 100
METRIC RATING
210th/ 347
METRIC RANK
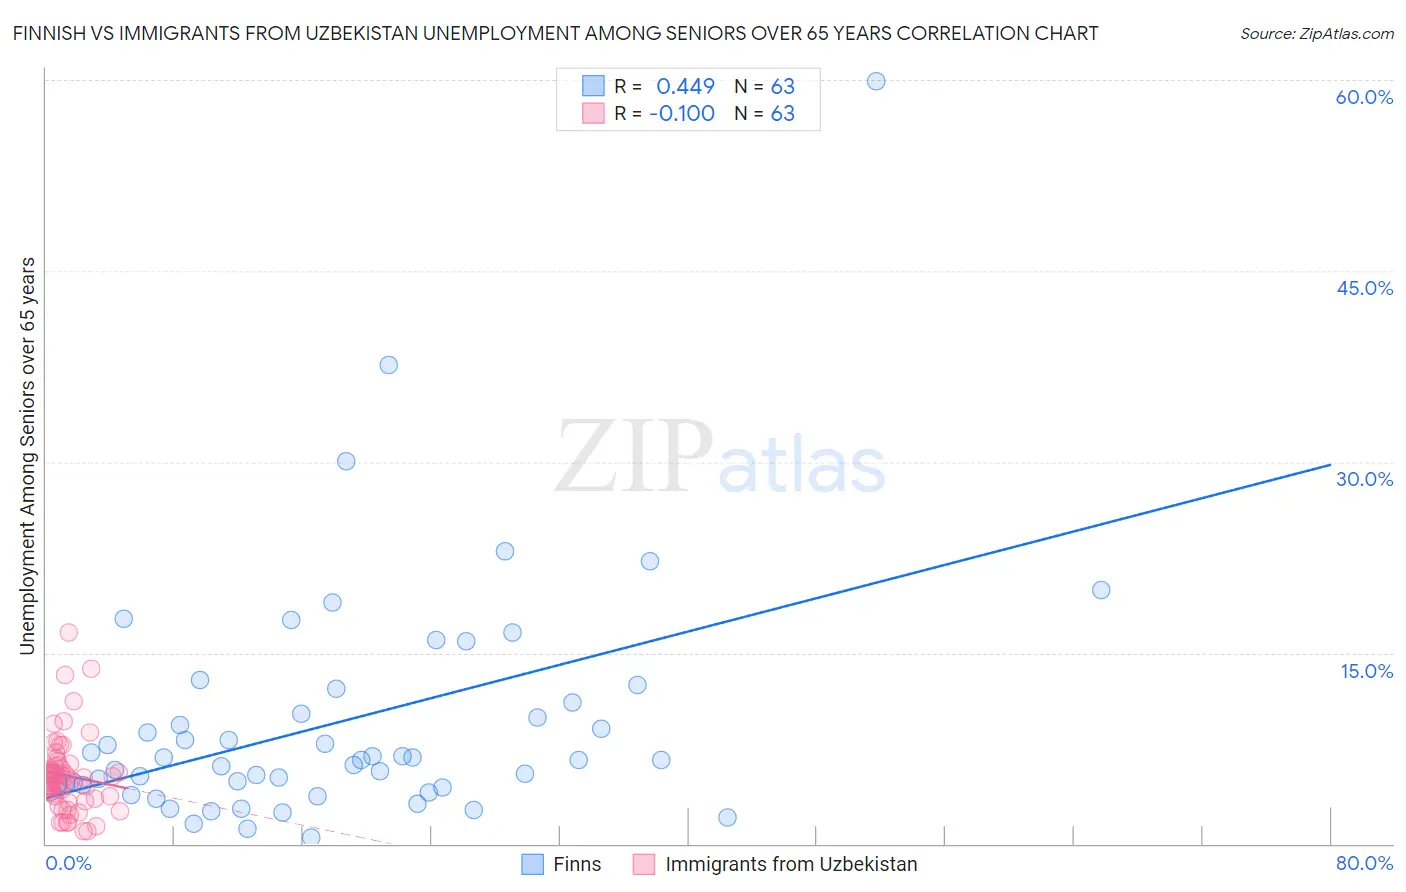
Finnish vs Immigrants from Uzbekistan Unemployment Among Seniors over 65 years Correlation Chart
The statistical analysis conducted on geographies consisting of 356,249,790 people shows a moderate positive correlation between the proportion of Finns and unemployment rate amomg seniors over the age of 65 in the United States with a correlation coefficient (R) of 0.449 and weighted average of 5.0%. Similarly, the statistical analysis conducted on geographies consisting of 115,415,286 people shows a slight negative correlation between the proportion of Immigrants from Uzbekistan and unemployment rate amomg seniors over the age of 65 in the United States with a correlation coefficient (R) of -0.100 and weighted average of 5.2%, a difference of 3.7%.
Unemployment Among Seniors over 65 years Correlation Summary
| Measurement | Finnish | Immigrants from Uzbekistan |
| Minimum | 0.50% | 1.0% |
| Maximum | 59.9% | 16.6% |
| Range | 59.4% | 15.6% |
| Mean | 9.5% | 5.4% |
| Median | 6.6% | 5.2% |
| Interquartile 25% (IQ1) | 4.6% | 3.5% |
| Interquartile 75% (IQ3) | 11.1% | 6.2% |
| Interquartile Range (IQR) | 6.5% | 2.7% |
| Standard Deviation (Sample) | 9.5% | 3.0% |
| Standard Deviation (Population) | 9.5% | 3.0% |
Similar Demographics by Unemployment Among Seniors over 65 years
Demographics Similar to Finns by Unemployment Among Seniors over 65 years
In terms of unemployment among seniors over 65 years, the demographic groups most similar to Finns are Eastern European (5.0%, a difference of 0.020%), Immigrants from Saudi Arabia (5.0%, a difference of 0.060%), Immigrants from Malaysia (5.0%, a difference of 0.070%), Seminole (5.0%, a difference of 0.080%), and Immigrants from Vietnam (5.0%, a difference of 0.090%).
| Demographics | Rating | Rank | Unemployment Among Seniors over 65 years |
| Immigrants | Scotland | 95.0 /100 | #104 | Exceptional 5.0% |
| Okinawans | 94.7 /100 | #105 | Exceptional 5.0% |
| Immigrants | Turkey | 94.3 /100 | #106 | Exceptional 5.0% |
| Immigrants | Germany | 93.2 /100 | #107 | Exceptional 5.0% |
| Immigrants | Vietnam | 92.9 /100 | #108 | Exceptional 5.0% |
| Immigrants | Malaysia | 92.7 /100 | #109 | Exceptional 5.0% |
| Immigrants | Saudi Arabia | 92.7 /100 | #110 | Exceptional 5.0% |
| Finns | 92.2 /100 | #111 | Exceptional 5.0% |
| Eastern Europeans | 92.0 /100 | #112 | Exceptional 5.0% |
| Seminole | 91.4 /100 | #113 | Exceptional 5.0% |
| Immigrants | Latvia | 91.4 /100 | #114 | Exceptional 5.0% |
| Celtics | 91.3 /100 | #115 | Exceptional 5.0% |
| Immigrants | Korea | 91.0 /100 | #116 | Exceptional 5.0% |
| Malaysians | 90.4 /100 | #117 | Exceptional 5.1% |
| Soviet Union | 90.1 /100 | #118 | Exceptional 5.1% |
Demographics Similar to Immigrants from Uzbekistan by Unemployment Among Seniors over 65 years
In terms of unemployment among seniors over 65 years, the demographic groups most similar to Immigrants from Uzbekistan are African (5.2%, a difference of 0.030%), Immigrants from Honduras (5.2%, a difference of 0.040%), Alsatian (5.2%, a difference of 0.050%), Immigrants from Uruguay (5.2%, a difference of 0.12%), and Uruguayan (5.2%, a difference of 0.14%).
| Demographics | Rating | Rank | Unemployment Among Seniors over 65 years |
| Sub-Saharan Africans | 17.1 /100 | #203 | Poor 5.2% |
| Immigrants | China | 16.9 /100 | #204 | Poor 5.2% |
| South American Indians | 15.3 /100 | #205 | Poor 5.2% |
| German Russians | 14.7 /100 | #206 | Poor 5.2% |
| Immigrants | Philippines | 13.2 /100 | #207 | Poor 5.2% |
| Uruguayans | 12.6 /100 | #208 | Poor 5.2% |
| Alsatians | 11.4 /100 | #209 | Poor 5.2% |
| Immigrants | Uzbekistan | 10.7 /100 | #210 | Poor 5.2% |
| Africans | 10.4 /100 | #211 | Poor 5.2% |
| Immigrants | Honduras | 10.2 /100 | #212 | Poor 5.2% |
| Immigrants | Uruguay | 9.3 /100 | #213 | Tragic 5.2% |
| Albanians | 9.1 /100 | #214 | Tragic 5.2% |
| Immigrants | Fiji | 8.6 /100 | #215 | Tragic 5.2% |
| Cajuns | 8.5 /100 | #216 | Tragic 5.2% |
| Italians | 8.3 /100 | #217 | Tragic 5.2% |