Immigrants from Iran vs Immigrants from Belize Unemployment Among Seniors over 65 years
COMPARE
Immigrants from Iran
Immigrants from Belize
Unemployment Among Seniors over 65 years
Unemployment Among Seniors over 65 years Comparison
Immigrants from Iran
Immigrants from Belize
5.2%
UNEMPLOYMENT AMONG SENIORS OVER 65 YEARS
36.0/ 100
METRIC RATING
185th/ 347
METRIC RANK
5.5%
UNEMPLOYMENT AMONG SENIORS OVER 65 YEARS
0.0/ 100
METRIC RATING
282nd/ 347
METRIC RANK
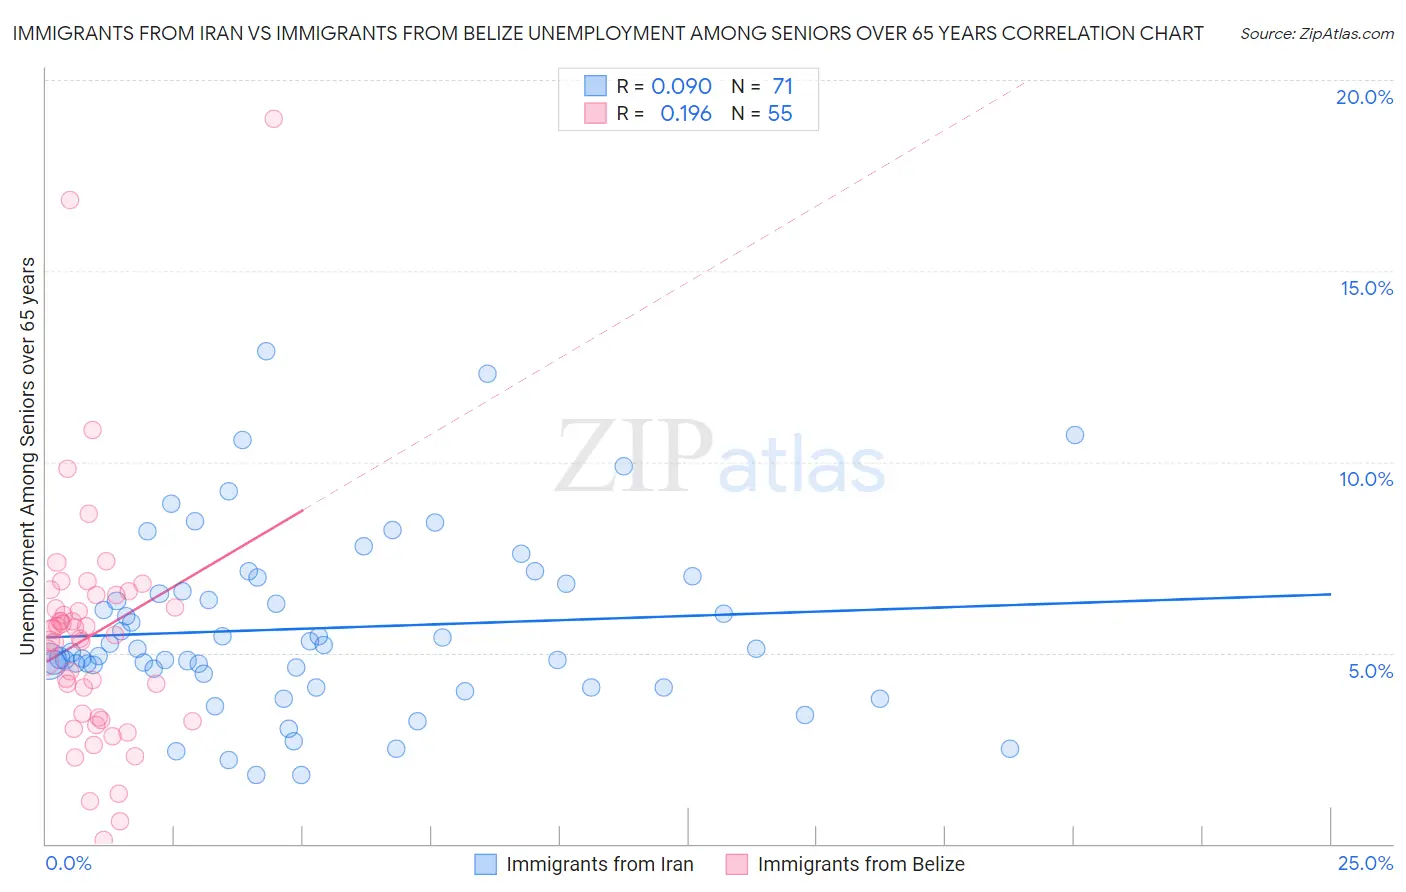
Immigrants from Iran vs Immigrants from Belize Unemployment Among Seniors over 65 years Correlation Chart
The statistical analysis conducted on geographies consisting of 264,234,718 people shows a slight positive correlation between the proportion of Immigrants from Iran and unemployment rate amomg seniors over the age of 65 in the United States with a correlation coefficient (R) of 0.090 and weighted average of 5.2%. Similarly, the statistical analysis conducted on geographies consisting of 125,826,150 people shows a poor positive correlation between the proportion of Immigrants from Belize and unemployment rate amomg seniors over the age of 65 in the United States with a correlation coefficient (R) of 0.196 and weighted average of 5.5%, a difference of 5.8%.
Unemployment Among Seniors over 65 years Correlation Summary
| Measurement | Immigrants from Iran | Immigrants from Belize |
| Minimum | 1.8% | 0.10% |
| Maximum | 12.9% | 19.0% |
| Range | 11.1% | 18.9% |
| Mean | 5.6% | 5.5% |
| Median | 5.1% | 5.5% |
| Interquartile 25% (IQ1) | 4.4% | 3.3% |
| Interquartile 75% (IQ3) | 6.8% | 6.5% |
| Interquartile Range (IQR) | 2.4% | 3.2% |
| Standard Deviation (Sample) | 2.3% | 3.2% |
| Standard Deviation (Population) | 2.3% | 3.2% |
Similar Demographics by Unemployment Among Seniors over 65 years
Demographics Similar to Immigrants from Iran by Unemployment Among Seniors over 65 years
In terms of unemployment among seniors over 65 years, the demographic groups most similar to Immigrants from Iran are American (5.2%, a difference of 0.030%), Somali (5.2%, a difference of 0.090%), Immigrants from Egypt (5.2%, a difference of 0.10%), Bangladeshi (5.2%, a difference of 0.13%), and Korean (5.2%, a difference of 0.16%).
| Demographics | Rating | Rank | Unemployment Among Seniors over 65 years |
| Immigrants | Belgium | 44.8 /100 | #178 | Average 5.2% |
| Immigrants | Somalia | 44.0 /100 | #179 | Average 5.2% |
| Russians | 43.6 /100 | #180 | Average 5.2% |
| Immigrants | Italy | 43.5 /100 | #181 | Average 5.2% |
| Panamanians | 43.0 /100 | #182 | Average 5.2% |
| Immigrants | Western Asia | 42.1 /100 | #183 | Average 5.2% |
| Immigrants | Serbia | 41.6 /100 | #184 | Average 5.2% |
| Immigrants | Iran | 36.0 /100 | #185 | Fair 5.2% |
| Americans | 35.1 /100 | #186 | Fair 5.2% |
| Somalis | 33.5 /100 | #187 | Fair 5.2% |
| Immigrants | Egypt | 33.2 /100 | #188 | Fair 5.2% |
| Bangladeshis | 32.3 /100 | #189 | Fair 5.2% |
| Koreans | 31.6 /100 | #190 | Fair 5.2% |
| Immigrants | Denmark | 31.0 /100 | #191 | Fair 5.2% |
| Sioux | 30.8 /100 | #192 | Fair 5.2% |
Demographics Similar to Immigrants from Belize by Unemployment Among Seniors over 65 years
In terms of unemployment among seniors over 65 years, the demographic groups most similar to Immigrants from Belize are Immigrants from Norway (5.5%, a difference of 0.13%), Immigrants from Haiti (5.5%, a difference of 0.19%), Immigrants from South America (5.5%, a difference of 0.28%), Brazilian (5.5%, a difference of 0.31%), and Colville (5.4%, a difference of 0.43%).
| Demographics | Rating | Rank | Unemployment Among Seniors over 65 years |
| Mexican American Indians | 0.1 /100 | #275 | Tragic 5.4% |
| Pueblo | 0.1 /100 | #276 | Tragic 5.4% |
| Immigrants | Western Africa | 0.1 /100 | #277 | Tragic 5.4% |
| Colville | 0.1 /100 | #278 | Tragic 5.4% |
| Brazilians | 0.1 /100 | #279 | Tragic 5.5% |
| Immigrants | South America | 0.1 /100 | #280 | Tragic 5.5% |
| Immigrants | Norway | 0.0 /100 | #281 | Tragic 5.5% |
| Immigrants | Belize | 0.0 /100 | #282 | Tragic 5.5% |
| Immigrants | Haiti | 0.0 /100 | #283 | Tragic 5.5% |
| Immigrants | Liberia | 0.0 /100 | #284 | Tragic 5.5% |
| Central Americans | 0.0 /100 | #285 | Tragic 5.5% |
| Immigrants | Barbados | 0.0 /100 | #286 | Tragic 5.5% |
| Venezuelans | 0.0 /100 | #287 | Tragic 5.5% |
| U.S. Virgin Islanders | 0.0 /100 | #288 | Tragic 5.5% |
| Immigrants | Cabo Verde | 0.0 /100 | #289 | Tragic 5.5% |