Filipino vs Senegalese Median Family Income
COMPARE
Filipino
Senegalese
Median Family Income
Median Family Income Comparison
Filipinos
Senegalese
$138,397
MEDIAN FAMILY INCOME
100.0/ 100
METRIC RATING
1st/ 347
METRIC RANK
$91,475
MEDIAN FAMILY INCOME
0.3/ 100
METRIC RATING
264th/ 347
METRIC RANK
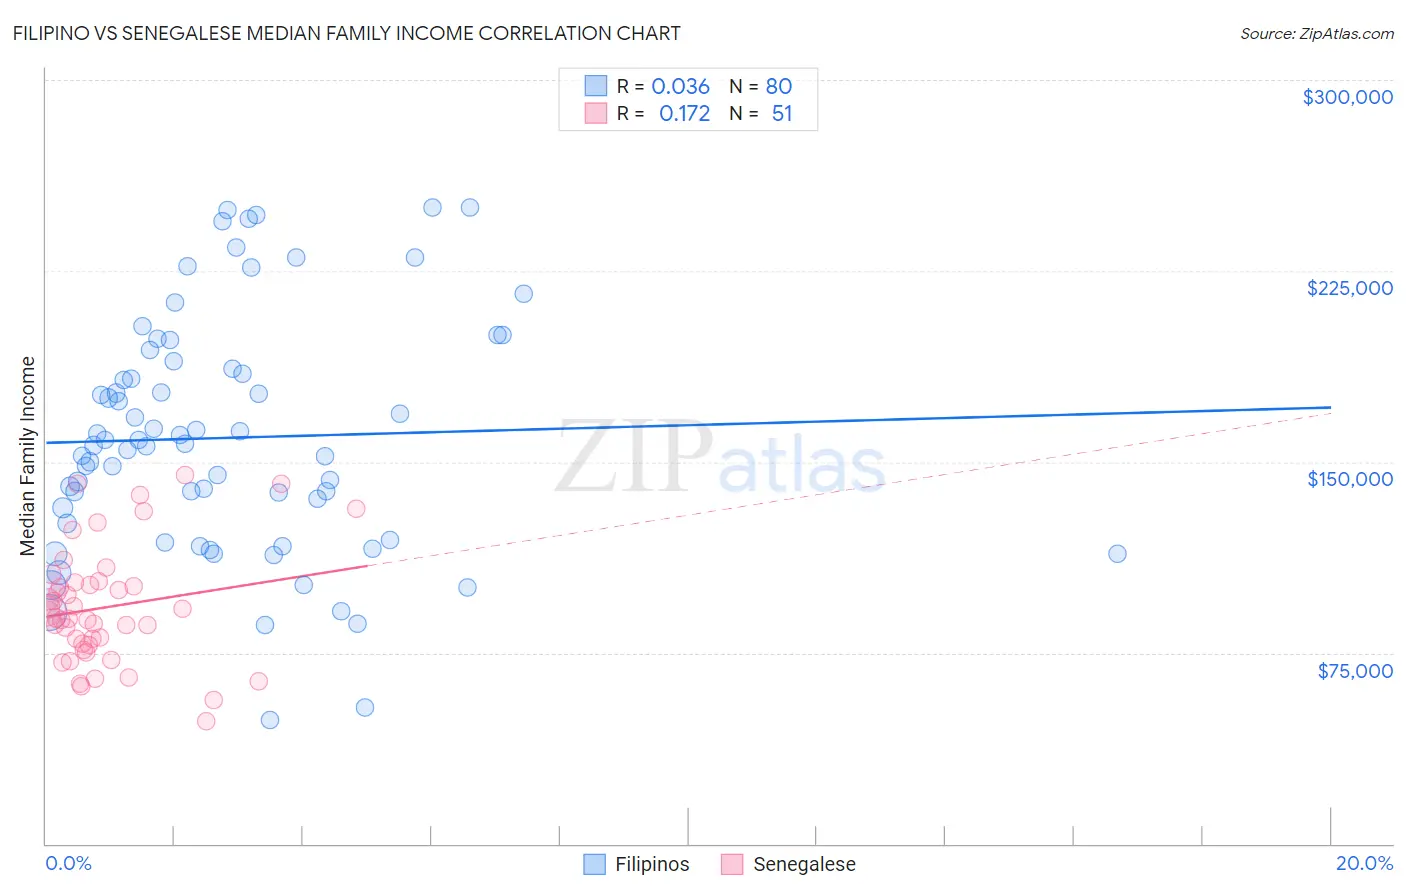
Filipino vs Senegalese Median Family Income Correlation Chart
The statistical analysis conducted on geographies consisting of 254,105,404 people shows no correlation between the proportion of Filipinos and median family income in the United States with a correlation coefficient (R) of 0.036 and weighted average of $138,397. Similarly, the statistical analysis conducted on geographies consisting of 78,068,441 people shows a poor positive correlation between the proportion of Senegalese and median family income in the United States with a correlation coefficient (R) of 0.172 and weighted average of $91,475, a difference of 51.3%.
Median Family Income Correlation Summary
| Measurement | Filipino | Senegalese |
| Minimum | $48,393 | $48,125 |
| Maximum | $250,001 | $145,000 |
| Range | $201,608 | $96,875 |
| Mean | $159,472 | $92,900 |
| Median | $156,854 | $88,669 |
| Interquartile 25% (IQ1) | $122,608 | $78,308 |
| Interquartile 75% (IQ3) | $188,025 | $102,554 |
| Interquartile Range (IQR) | $65,417 | $24,246 |
| Standard Deviation (Sample) | $46,927 | $22,975 |
| Standard Deviation (Population) | $46,633 | $22,749 |
Similar Demographics by Median Family Income
Demographics Similar to Filipinos by Median Family Income
In terms of median family income, the demographic groups most similar to Filipinos are Immigrants from Taiwan ($136,949, a difference of 1.1%), Immigrants from Singapore ($134,818, a difference of 2.6%), Immigrants from India ($134,028, a difference of 3.3%), Iranian ($133,839, a difference of 3.4%), and Thai ($131,281, a difference of 5.4%).
| Demographics | Rating | Rank | Median Family Income |
| Filipinos | 100.0 /100 | #1 | Exceptional $138,397 |
| Immigrants | Taiwan | 100.0 /100 | #2 | Exceptional $136,949 |
| Immigrants | Singapore | 100.0 /100 | #3 | Exceptional $134,818 |
| Immigrants | India | 100.0 /100 | #4 | Exceptional $134,028 |
| Iranians | 100.0 /100 | #5 | Exceptional $133,839 |
| Thais | 100.0 /100 | #6 | Exceptional $131,281 |
| Immigrants | Hong Kong | 100.0 /100 | #7 | Exceptional $131,067 |
| Immigrants | Iran | 100.0 /100 | #8 | Exceptional $130,894 |
| Okinawans | 100.0 /100 | #9 | Exceptional $129,979 |
| Immigrants | Ireland | 100.0 /100 | #10 | Exceptional $127,584 |
| Immigrants | Israel | 100.0 /100 | #11 | Exceptional $127,430 |
| Cypriots | 100.0 /100 | #12 | Exceptional $127,064 |
| Immigrants | Australia | 100.0 /100 | #13 | Exceptional $126,620 |
| Immigrants | South Central Asia | 100.0 /100 | #14 | Exceptional $125,956 |
| Eastern Europeans | 100.0 /100 | #15 | Exceptional $125,546 |
Demographics Similar to Senegalese by Median Family Income
In terms of median family income, the demographic groups most similar to Senegalese are Immigrants from West Indies ($91,588, a difference of 0.12%), Hmong ($91,296, a difference of 0.20%), Liberian ($91,722, a difference of 0.27%), Inupiat ($91,730, a difference of 0.28%), and Pennsylvania German ($91,763, a difference of 0.31%).
| Demographics | Rating | Rank | Median Family Income |
| Americans | 0.4 /100 | #257 | Tragic $92,096 |
| Osage | 0.4 /100 | #258 | Tragic $91,926 |
| Cape Verdeans | 0.4 /100 | #259 | Tragic $91,848 |
| Pennsylvania Germans | 0.4 /100 | #260 | Tragic $91,763 |
| Inupiat | 0.4 /100 | #261 | Tragic $91,730 |
| Liberians | 0.4 /100 | #262 | Tragic $91,722 |
| Immigrants | West Indies | 0.3 /100 | #263 | Tragic $91,588 |
| Senegalese | 0.3 /100 | #264 | Tragic $91,475 |
| Hmong | 0.3 /100 | #265 | Tragic $91,296 |
| Central Americans | 0.3 /100 | #266 | Tragic $91,087 |
| Mexican American Indians | 0.2 /100 | #267 | Tragic $90,918 |
| Cree | 0.2 /100 | #268 | Tragic $90,882 |
| Belizeans | 0.2 /100 | #269 | Tragic $90,880 |
| Jamaicans | 0.2 /100 | #270 | Tragic $90,581 |
| Iroquois | 0.2 /100 | #271 | Tragic $90,543 |