Immigrants from Kuwait vs Immigrants from Sierra Leone Unemployment Among Women with Children Under 6 years
COMPARE
Immigrants from Kuwait
Immigrants from Sierra Leone
Unemployment Among Women with Children Under 6 years
Unemployment Among Women with Children Under 6 years Comparison
Immigrants from Kuwait
Immigrants from Sierra Leone
6.9%
UNEMPLOYMENT AMONG WOMEN WITH CHILDREN UNDER 6 YEARS
99.7/ 100
METRIC RATING
65th/ 347
METRIC RANK
8.2%
UNEMPLOYMENT AMONG WOMEN WITH CHILDREN UNDER 6 YEARS
1.1/ 100
METRIC RATING
249th/ 347
METRIC RANK
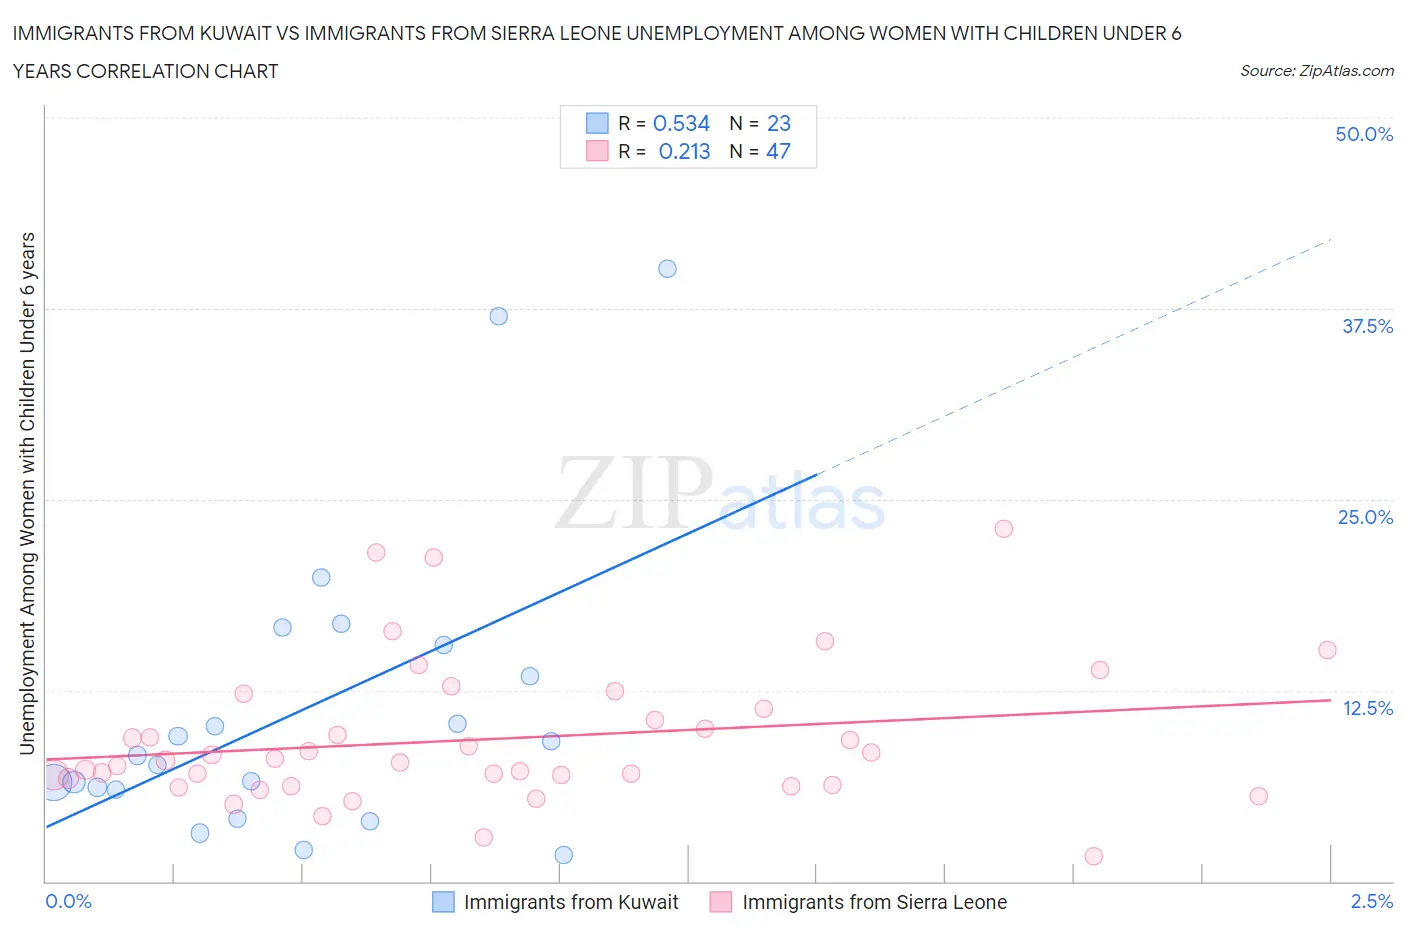
Immigrants from Kuwait vs Immigrants from Sierra Leone Unemployment Among Women with Children Under 6 years Correlation Chart
The statistical analysis conducted on geographies consisting of 121,724,889 people shows a substantial positive correlation between the proportion of Immigrants from Kuwait and unemployment rate among women with children under the age of 6 in the United States with a correlation coefficient (R) of 0.534 and weighted average of 6.9%. Similarly, the statistical analysis conducted on geographies consisting of 92,718,305 people shows a weak positive correlation between the proportion of Immigrants from Sierra Leone and unemployment rate among women with children under the age of 6 in the United States with a correlation coefficient (R) of 0.213 and weighted average of 8.2%, a difference of 18.7%.
Unemployment Among Women with Children Under 6 years Correlation Summary
| Measurement | Immigrants from Kuwait | Immigrants from Sierra Leone |
| Minimum | 1.7% | 1.6% |
| Maximum | 40.1% | 23.1% |
| Range | 38.4% | 21.5% |
| Mean | 11.3% | 9.3% |
| Median | 8.2% | 7.9% |
| Interquartile 25% (IQ1) | 6.0% | 6.3% |
| Interquartile 75% (IQ3) | 15.5% | 11.3% |
| Interquartile Range (IQR) | 9.5% | 5.0% |
| Standard Deviation (Sample) | 9.9% | 4.6% |
| Standard Deviation (Population) | 9.7% | 4.6% |
Similar Demographics by Unemployment Among Women with Children Under 6 years
Demographics Similar to Immigrants from Kuwait by Unemployment Among Women with Children Under 6 years
In terms of unemployment among women with children under 6 years, the demographic groups most similar to Immigrants from Kuwait are Tongan (6.9%, a difference of 0.15%), Immigrants from Belgium (6.9%, a difference of 0.22%), Maltese (6.9%, a difference of 0.25%), Somali (6.9%, a difference of 0.29%), and Immigrants from France (6.9%, a difference of 0.33%).
| Demographics | Rating | Rank | Unemployment Among Women with Children Under 6 years |
| Immigrants | Turkey | 99.8 /100 | #58 | Exceptional 6.9% |
| Immigrants | Serbia | 99.8 /100 | #59 | Exceptional 6.9% |
| Immigrants | Sri Lanka | 99.8 /100 | #60 | Exceptional 6.9% |
| Immigrants | France | 99.7 /100 | #61 | Exceptional 6.9% |
| Somalis | 99.7 /100 | #62 | Exceptional 6.9% |
| Maltese | 99.7 /100 | #63 | Exceptional 6.9% |
| Tongans | 99.7 /100 | #64 | Exceptional 6.9% |
| Immigrants | Kuwait | 99.7 /100 | #65 | Exceptional 6.9% |
| Immigrants | Belgium | 99.6 /100 | #66 | Exceptional 6.9% |
| Immigrants | Netherlands | 99.5 /100 | #67 | Exceptional 7.0% |
| Paraguayans | 99.4 /100 | #68 | Exceptional 7.0% |
| Immigrants | Eritrea | 99.4 /100 | #69 | Exceptional 7.0% |
| Immigrants | Iraq | 99.4 /100 | #70 | Exceptional 7.0% |
| Afghans | 99.4 /100 | #71 | Exceptional 7.0% |
| Cubans | 99.4 /100 | #72 | Exceptional 7.0% |
Demographics Similar to Immigrants from Sierra Leone by Unemployment Among Women with Children Under 6 years
In terms of unemployment among women with children under 6 years, the demographic groups most similar to Immigrants from Sierra Leone are Nigerian (8.2%, a difference of 0.010%), Immigrants from Western Africa (8.2%, a difference of 0.090%), German Russian (8.2%, a difference of 0.13%), Guyanese (8.2%, a difference of 0.18%), and Ghanaian (8.2%, a difference of 0.18%).
| Demographics | Rating | Rank | Unemployment Among Women with Children Under 6 years |
| Dutch | 2.5 /100 | #242 | Tragic 8.1% |
| Hawaiians | 1.8 /100 | #243 | Tragic 8.2% |
| French | 1.7 /100 | #244 | Tragic 8.2% |
| Native Hawaiians | 1.7 /100 | #245 | Tragic 8.2% |
| Central Americans | 1.4 /100 | #246 | Tragic 8.2% |
| German Russians | 1.2 /100 | #247 | Tragic 8.2% |
| Immigrants | Western Africa | 1.1 /100 | #248 | Tragic 8.2% |
| Immigrants | Sierra Leone | 1.1 /100 | #249 | Tragic 8.2% |
| Nigerians | 1.1 /100 | #250 | Tragic 8.2% |
| Guyanese | 1.0 /100 | #251 | Tragic 8.2% |
| Ghanaians | 1.0 /100 | #252 | Tragic 8.2% |
| Immigrants | Guyana | 0.8 /100 | #253 | Tragic 8.2% |
| Immigrants | Caribbean | 0.7 /100 | #254 | Tragic 8.3% |
| Immigrants | Portugal | 0.6 /100 | #255 | Tragic 8.3% |
| Celtics | 0.6 /100 | #256 | Tragic 8.3% |