Fijian vs Tsimshian Unemployment Among Ages 60 to 64 years
COMPARE
Fijian
Tsimshian
Unemployment Among Ages 60 to 64 years
Unemployment Among Ages 60 to 64 years Comparison
Fijians
Tsimshian
3.9%
UNEMPLOYMENT AMONG AGES 60 TO 64 YEARS
100.0/ 100
METRIC RATING
2nd/ 347
METRIC RANK
4.4%
UNEMPLOYMENT AMONG AGES 60 TO 64 YEARS
100.0/ 100
METRIC RATING
19th/ 347
METRIC RANK
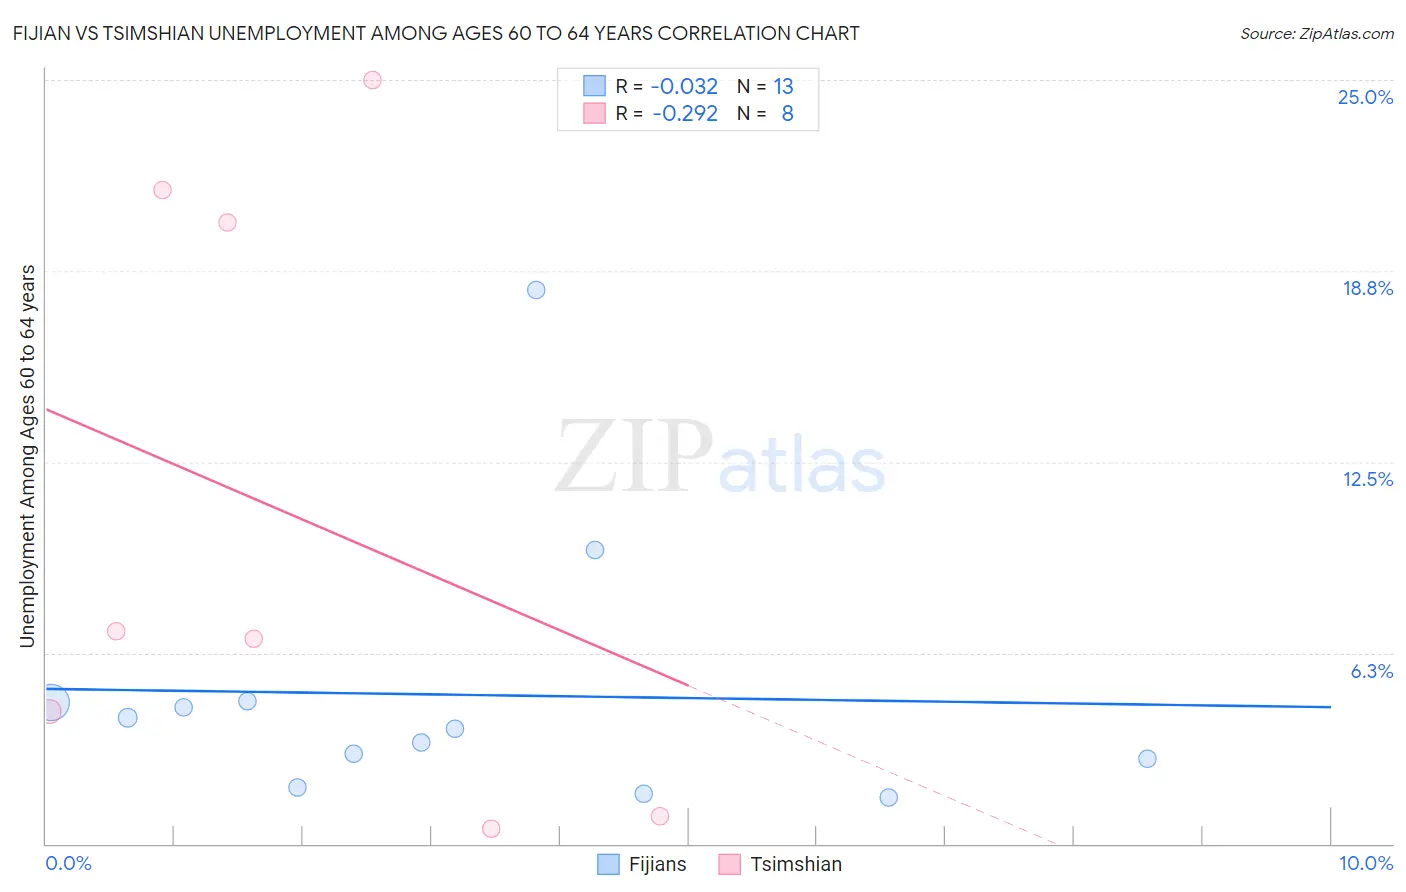
Fijian vs Tsimshian Unemployment Among Ages 60 to 64 years Correlation Chart
The statistical analysis conducted on geographies consisting of 53,532,695 people shows no correlation between the proportion of Fijians and unemployment rate among population between the ages 60 and 64 in the United States with a correlation coefficient (R) of -0.032 and weighted average of 3.9%. Similarly, the statistical analysis conducted on geographies consisting of 15,181,017 people shows a weak negative correlation between the proportion of Tsimshian and unemployment rate among population between the ages 60 and 64 in the United States with a correlation coefficient (R) of -0.292 and weighted average of 4.4%, a difference of 12.9%.
Unemployment Among Ages 60 to 64 years Correlation Summary
| Measurement | Fijian | Tsimshian |
| Minimum | 1.5% | 0.50% |
| Maximum | 18.1% | 25.0% |
| Range | 16.6% | 24.5% |
| Mean | 4.9% | 10.8% |
| Median | 3.8% | 6.8% |
| Interquartile 25% (IQ1) | 2.3% | 2.6% |
| Interquartile 75% (IQ3) | 4.6% | 20.9% |
| Interquartile Range (IQR) | 2.3% | 18.3% |
| Standard Deviation (Sample) | 4.5% | 9.9% |
| Standard Deviation (Population) | 4.3% | 9.2% |
Demographics Similar to Fijians and Tsimshian by Unemployment Among Ages 60 to 64 years
In terms of unemployment among ages 60 to 64 years, the demographic groups most similar to Fijians are Chinese (4.0%, a difference of 2.9%), Hmong (4.0%, a difference of 3.3%), Immigrants from the Azores (4.0%, a difference of 3.3%), Marshallese (3.7%, a difference of 3.7%), and Immigrants from Congo (4.1%, a difference of 6.2%). Similarly, the demographic groups most similar to Tsimshian are Slovene (4.4%, a difference of 0.11%), Afghan (4.4%, a difference of 0.14%), Immigrants from Afghanistan (4.4%, a difference of 0.51%), Danish (4.4%, a difference of 0.67%), and Sudanese (4.3%, a difference of 0.93%).
| Demographics | Rating | Rank | Unemployment Among Ages 60 to 64 years |
| Marshallese | 100.0 /100 | #1 | Exceptional 3.7% |
| Fijians | 100.0 /100 | #2 | Exceptional 3.9% |
| Chinese | 100.0 /100 | #3 | Exceptional 4.0% |
| Hmong | 100.0 /100 | #4 | Exceptional 4.0% |
| Immigrants | Azores | 100.0 /100 | #5 | Exceptional 4.0% |
| Immigrants | Congo | 100.0 /100 | #6 | Exceptional 4.1% |
| Lumbee | 100.0 /100 | #7 | Exceptional 4.2% |
| Immigrants | Micronesia | 100.0 /100 | #8 | Exceptional 4.2% |
| Indonesians | 100.0 /100 | #9 | Exceptional 4.2% |
| Immigrants | Bosnia and Herzegovina | 100.0 /100 | #10 | Exceptional 4.2% |
| Luxembourgers | 100.0 /100 | #11 | Exceptional 4.3% |
| Immigrants | Cuba | 100.0 /100 | #12 | Exceptional 4.3% |
| Chickasaw | 100.0 /100 | #13 | Exceptional 4.3% |
| Norwegians | 100.0 /100 | #14 | Exceptional 4.3% |
| Sudanese | 100.0 /100 | #15 | Exceptional 4.3% |
| Danes | 100.0 /100 | #16 | Exceptional 4.4% |
| Immigrants | Afghanistan | 100.0 /100 | #17 | Exceptional 4.4% |
| Slovenes | 100.0 /100 | #18 | Exceptional 4.4% |
| Tsimshian | 100.0 /100 | #19 | Exceptional 4.4% |
| Afghans | 100.0 /100 | #20 | Exceptional 4.4% |