European vs Immigrants from Serbia Male Unemployment
COMPARE
European
Immigrants from Serbia
Male Unemployment
Male Unemployment Comparison
Europeans
Immigrants from Serbia
4.8%
MALE UNEMPLOYMENT
99.9/ 100
METRIC RATING
19th/ 347
METRIC RANK
5.1%
MALE UNEMPLOYMENT
94.2/ 100
METRIC RATING
93rd/ 347
METRIC RANK
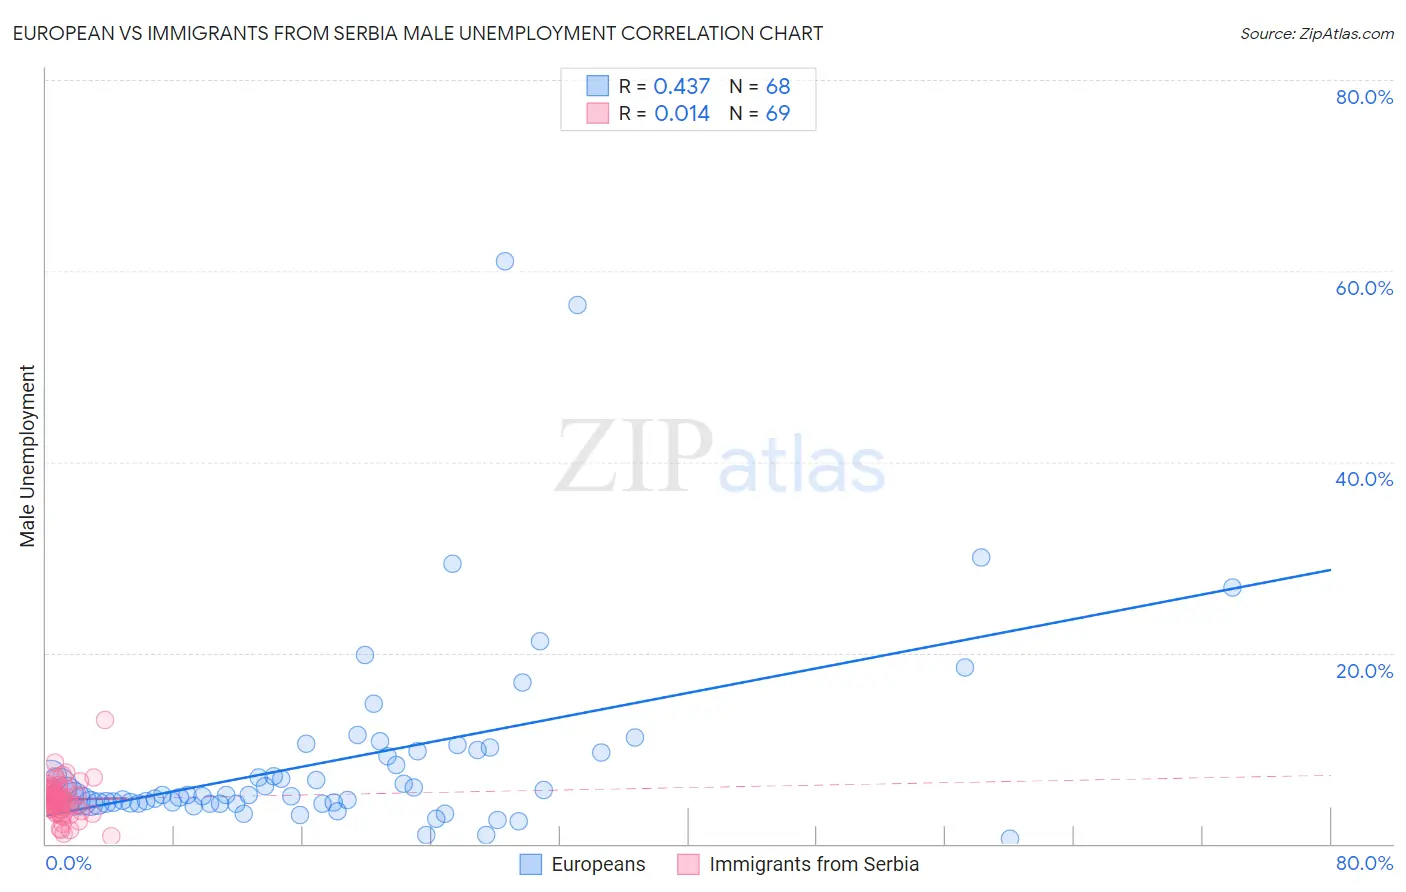
European vs Immigrants from Serbia Male Unemployment Correlation Chart
The statistical analysis conducted on geographies consisting of 552,402,688 people shows a moderate positive correlation between the proportion of Europeans and unemployment rate among males in the United States with a correlation coefficient (R) of 0.437 and weighted average of 4.8%. Similarly, the statistical analysis conducted on geographies consisting of 131,612,227 people shows no correlation between the proportion of Immigrants from Serbia and unemployment rate among males in the United States with a correlation coefficient (R) of 0.014 and weighted average of 5.1%, a difference of 6.7%.
Male Unemployment Correlation Summary
| Measurement | European | Immigrants from Serbia |
| Minimum | 0.50% | 0.80% |
| Maximum | 61.0% | 12.9% |
| Range | 60.5% | 12.1% |
| Mean | 9.0% | 4.6% |
| Median | 5.1% | 4.8% |
| Interquartile 25% (IQ1) | 4.2% | 3.6% |
| Interquartile 75% (IQ3) | 9.7% | 5.5% |
| Interquartile Range (IQR) | 5.5% | 1.9% |
| Standard Deviation (Sample) | 10.7% | 1.8% |
| Standard Deviation (Population) | 10.6% | 1.8% |
Similar Demographics by Male Unemployment
Demographics Similar to Europeans by Male Unemployment
In terms of male unemployment, the demographic groups most similar to Europeans are English (4.8%, a difference of 0.030%), Pennsylvania German (4.8%, a difference of 0.050%), Immigrants from Taiwan (4.8%, a difference of 0.22%), Carpatho Rusyn (4.8%, a difference of 0.23%), and Tongan (4.8%, a difference of 0.27%).
| Demographics | Rating | Rank | Male Unemployment |
| Immigrants | Bolivia | 100.0 /100 | #12 | Exceptional 4.7% |
| Bolivians | 100.0 /100 | #13 | Exceptional 4.7% |
| Germans | 100.0 /100 | #14 | Exceptional 4.7% |
| Scandinavians | 100.0 /100 | #15 | Exceptional 4.7% |
| Swiss | 99.9 /100 | #16 | Exceptional 4.7% |
| Filipinos | 99.9 /100 | #17 | Exceptional 4.7% |
| English | 99.9 /100 | #18 | Exceptional 4.8% |
| Europeans | 99.9 /100 | #19 | Exceptional 4.8% |
| Pennsylvania Germans | 99.9 /100 | #20 | Exceptional 4.8% |
| Immigrants | Taiwan | 99.9 /100 | #21 | Exceptional 4.8% |
| Carpatho Rusyns | 99.9 /100 | #22 | Exceptional 4.8% |
| Tongans | 99.9 /100 | #23 | Exceptional 4.8% |
| Immigrants | South Central Asia | 99.9 /100 | #24 | Exceptional 4.8% |
| Zimbabweans | 99.9 /100 | #25 | Exceptional 4.8% |
| Dutch | 99.9 /100 | #26 | Exceptional 4.8% |
Demographics Similar to Immigrants from Serbia by Male Unemployment
In terms of male unemployment, the demographic groups most similar to Immigrants from Serbia are Slavic (5.1%, a difference of 0.0%), Canadian (5.1%, a difference of 0.050%), Immigrants from Turkey (5.1%, a difference of 0.060%), Italian (5.1%, a difference of 0.12%), and Okinawan (5.1%, a difference of 0.14%).
| Demographics | Rating | Rank | Male Unemployment |
| Maltese | 95.5 /100 | #86 | Exceptional 5.1% |
| Immigrants | Romania | 95.4 /100 | #87 | Exceptional 5.1% |
| Immigrants | Sri Lanka | 94.9 /100 | #88 | Exceptional 5.1% |
| Immigrants | Australia | 94.7 /100 | #89 | Exceptional 5.1% |
| Okinawans | 94.7 /100 | #90 | Exceptional 5.1% |
| Immigrants | Turkey | 94.4 /100 | #91 | Exceptional 5.1% |
| Slavs | 94.2 /100 | #92 | Exceptional 5.1% |
| Immigrants | Serbia | 94.2 /100 | #93 | Exceptional 5.1% |
| Canadians | 94.1 /100 | #94 | Exceptional 5.1% |
| Italians | 93.8 /100 | #95 | Exceptional 5.1% |
| Asians | 93.7 /100 | #96 | Exceptional 5.1% |
| Immigrants | Spain | 93.4 /100 | #97 | Exceptional 5.1% |
| Immigrants | Kuwait | 93.3 /100 | #98 | Exceptional 5.1% |
| Uruguayans | 93.0 /100 | #99 | Exceptional 5.1% |
| Russians | 92.9 /100 | #100 | Exceptional 5.1% |