European vs Spanish American Unemployment
COMPARE
European
Spanish American
Unemployment
Unemployment Comparison
Europeans
Spanish Americans
4.6%
UNEMPLOYMENT
99.9/ 100
METRIC RATING
15th/ 347
METRIC RANK
5.6%
UNEMPLOYMENT
2.0/ 100
METRIC RATING
242nd/ 347
METRIC RANK
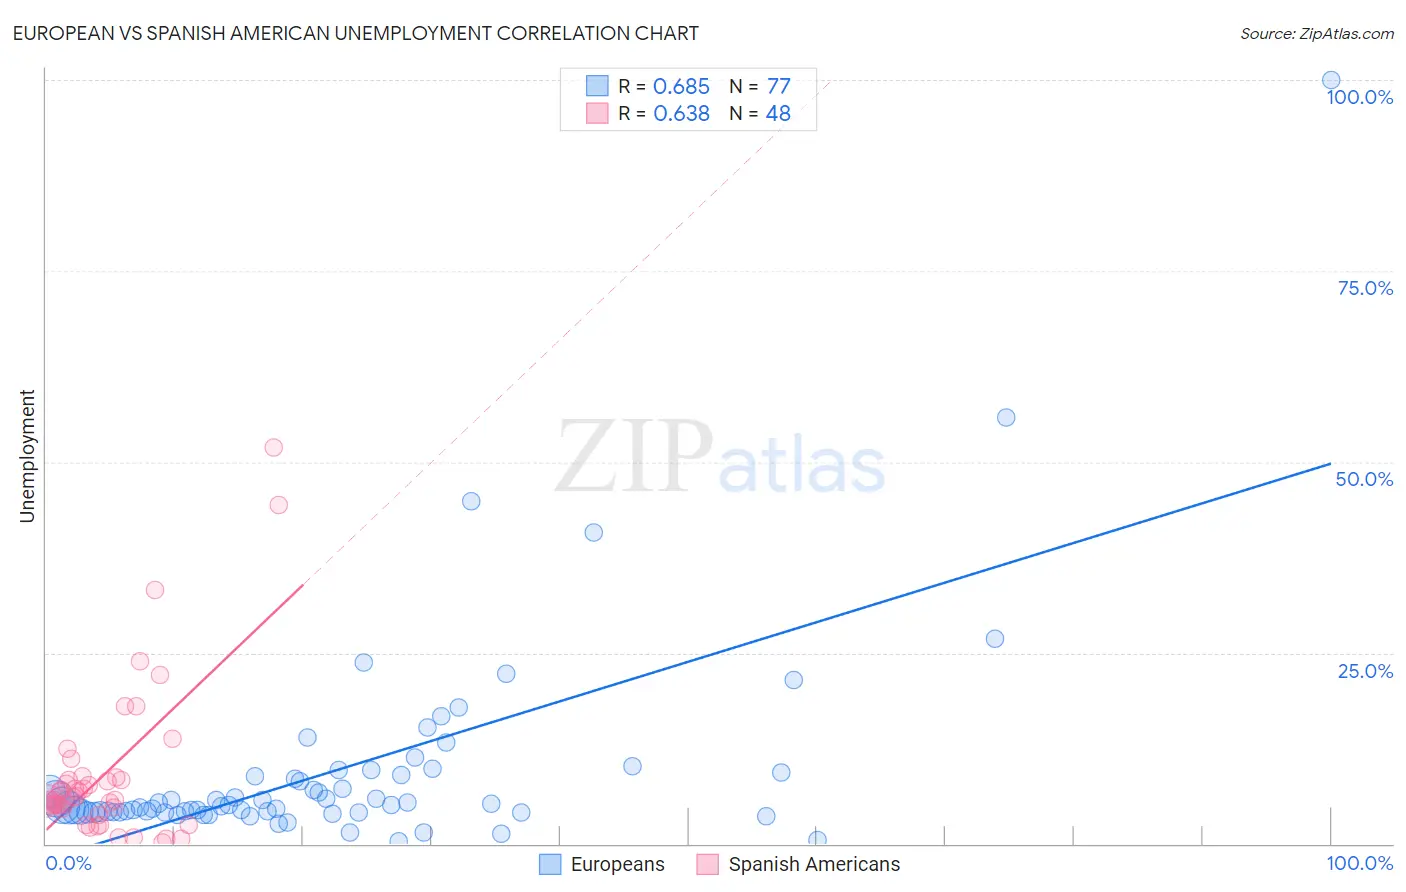
European vs Spanish American Unemployment Correlation Chart
The statistical analysis conducted on geographies consisting of 558,532,246 people shows a significant positive correlation between the proportion of Europeans and unemployment in the United States with a correlation coefficient (R) of 0.685 and weighted average of 4.6%. Similarly, the statistical analysis conducted on geographies consisting of 103,137,220 people shows a significant positive correlation between the proportion of Spanish Americans and unemployment in the United States with a correlation coefficient (R) of 0.638 and weighted average of 5.6%, a difference of 19.9%.
Unemployment Correlation Summary
| Measurement | European | Spanish American |
| Minimum | 0.40% | 0.10% |
| Maximum | 100.0% | 51.9% |
| Range | 99.6% | 51.8% |
| Mean | 9.7% | 9.2% |
| Median | 5.0% | 5.9% |
| Interquartile 25% (IQ1) | 4.2% | 4.7% |
| Interquartile 75% (IQ3) | 9.2% | 8.5% |
| Interquartile Range (IQR) | 5.0% | 3.8% |
| Standard Deviation (Sample) | 14.1% | 10.4% |
| Standard Deviation (Population) | 14.0% | 10.3% |
Similar Demographics by Unemployment
Demographics Similar to Europeans by Unemployment
In terms of unemployment, the demographic groups most similar to Europeans are Chinese (4.7%, a difference of 0.14%), Slovene (4.7%, a difference of 0.24%), Immigrants from Venezuela (4.7%, a difference of 0.27%), Scottish (4.7%, a difference of 0.35%), and Immigrants from Cuba (4.6%, a difference of 0.48%).
| Demographics | Rating | Rank | Unemployment |
| Swiss | 100.0 /100 | #8 | Exceptional 4.5% |
| Scandinavians | 100.0 /100 | #9 | Exceptional 4.5% |
| Dutch | 100.0 /100 | #10 | Exceptional 4.6% |
| English | 100.0 /100 | #11 | Exceptional 4.6% |
| Pennsylvania Germans | 100.0 /100 | #12 | Exceptional 4.6% |
| Belgians | 100.0 /100 | #13 | Exceptional 4.6% |
| Immigrants | Cuba | 100.0 /100 | #14 | Exceptional 4.6% |
| Europeans | 99.9 /100 | #15 | Exceptional 4.6% |
| Chinese | 99.9 /100 | #16 | Exceptional 4.7% |
| Slovenes | 99.9 /100 | #17 | Exceptional 4.7% |
| Immigrants | Venezuela | 99.9 /100 | #18 | Exceptional 4.7% |
| Scottish | 99.9 /100 | #19 | Exceptional 4.7% |
| Carpatho Rusyns | 99.9 /100 | #20 | Exceptional 4.7% |
| Welsh | 99.9 /100 | #21 | Exceptional 4.7% |
| Thais | 99.9 /100 | #22 | Exceptional 4.7% |
Demographics Similar to Spanish Americans by Unemployment
In terms of unemployment, the demographic groups most similar to Spanish Americans are Tlingit-Haida (5.6%, a difference of 0.0%), Cree (5.6%, a difference of 0.35%), Immigrants (5.5%, a difference of 0.36%), Immigrants from Western Asia (5.5%, a difference of 0.45%), and Marshallese (5.6%, a difference of 0.64%).
| Demographics | Rating | Rank | Unemployment |
| Immigrants | Panama | 3.4 /100 | #235 | Tragic 5.5% |
| Immigrants | Cambodia | 3.3 /100 | #236 | Tragic 5.5% |
| Moroccans | 3.2 /100 | #237 | Tragic 5.5% |
| Immigrants | Western Asia | 2.8 /100 | #238 | Tragic 5.5% |
| Immigrants | Immigrants | 2.6 /100 | #239 | Tragic 5.5% |
| Cree | 2.6 /100 | #240 | Tragic 5.6% |
| Tlingit-Haida | 2.0 /100 | #241 | Tragic 5.6% |
| Spanish Americans | 2.0 /100 | #242 | Tragic 5.6% |
| Marshallese | 1.3 /100 | #243 | Tragic 5.6% |
| Dutch West Indians | 1.2 /100 | #244 | Tragic 5.6% |
| French American Indians | 1.2 /100 | #245 | Tragic 5.6% |
| Bermudans | 1.1 /100 | #246 | Tragic 5.6% |
| Immigrants | Cameroon | 1.0 /100 | #247 | Tragic 5.6% |
| Liberians | 0.9 /100 | #248 | Tragic 5.6% |
| Cajuns | 0.8 /100 | #249 | Tragic 5.6% |