European vs Immigrants from Thailand Male Unemployment
COMPARE
European
Immigrants from Thailand
Male Unemployment
Male Unemployment Comparison
Europeans
Immigrants from Thailand
4.8%
MALE UNEMPLOYMENT
99.9/ 100
METRIC RATING
19th/ 347
METRIC RANK
5.4%
MALE UNEMPLOYMENT
14.7/ 100
METRIC RATING
198th/ 347
METRIC RANK
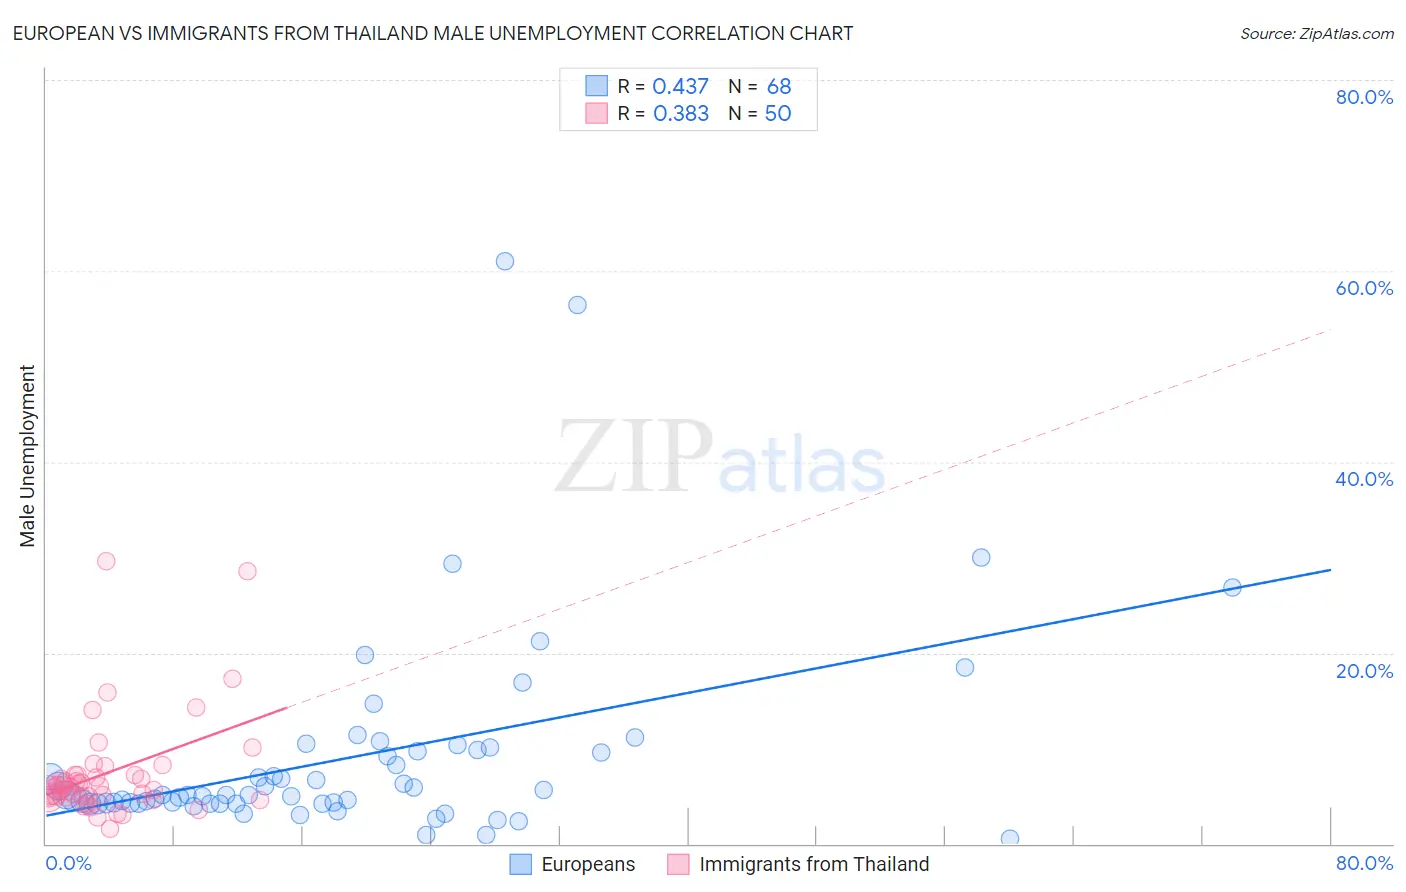
European vs Immigrants from Thailand Male Unemployment Correlation Chart
The statistical analysis conducted on geographies consisting of 552,402,688 people shows a moderate positive correlation between the proportion of Europeans and unemployment rate among males in the United States with a correlation coefficient (R) of 0.437 and weighted average of 4.8%. Similarly, the statistical analysis conducted on geographies consisting of 316,225,020 people shows a mild positive correlation between the proportion of Immigrants from Thailand and unemployment rate among males in the United States with a correlation coefficient (R) of 0.383 and weighted average of 5.4%, a difference of 14.1%.
Male Unemployment Correlation Summary
| Measurement | European | Immigrants from Thailand |
| Minimum | 0.50% | 1.6% |
| Maximum | 61.0% | 29.6% |
| Range | 60.5% | 28.0% |
| Mean | 9.0% | 7.4% |
| Median | 5.1% | 5.9% |
| Interquartile 25% (IQ1) | 4.2% | 5.0% |
| Interquartile 75% (IQ3) | 9.7% | 7.2% |
| Interquartile Range (IQR) | 5.5% | 2.2% |
| Standard Deviation (Sample) | 10.7% | 5.5% |
| Standard Deviation (Population) | 10.6% | 5.4% |
Similar Demographics by Male Unemployment
Demographics Similar to Europeans by Male Unemployment
In terms of male unemployment, the demographic groups most similar to Europeans are English (4.8%, a difference of 0.030%), Pennsylvania German (4.8%, a difference of 0.050%), Immigrants from Taiwan (4.8%, a difference of 0.22%), Carpatho Rusyn (4.8%, a difference of 0.23%), and Tongan (4.8%, a difference of 0.27%).
| Demographics | Rating | Rank | Male Unemployment |
| Immigrants | Bolivia | 100.0 /100 | #12 | Exceptional 4.7% |
| Bolivians | 100.0 /100 | #13 | Exceptional 4.7% |
| Germans | 100.0 /100 | #14 | Exceptional 4.7% |
| Scandinavians | 100.0 /100 | #15 | Exceptional 4.7% |
| Swiss | 99.9 /100 | #16 | Exceptional 4.7% |
| Filipinos | 99.9 /100 | #17 | Exceptional 4.7% |
| English | 99.9 /100 | #18 | Exceptional 4.8% |
| Europeans | 99.9 /100 | #19 | Exceptional 4.8% |
| Pennsylvania Germans | 99.9 /100 | #20 | Exceptional 4.8% |
| Immigrants | Taiwan | 99.9 /100 | #21 | Exceptional 4.8% |
| Carpatho Rusyns | 99.9 /100 | #22 | Exceptional 4.8% |
| Tongans | 99.9 /100 | #23 | Exceptional 4.8% |
| Immigrants | South Central Asia | 99.9 /100 | #24 | Exceptional 4.8% |
| Zimbabweans | 99.9 /100 | #25 | Exceptional 4.8% |
| Dutch | 99.9 /100 | #26 | Exceptional 4.8% |
Demographics Similar to Immigrants from Thailand by Male Unemployment
In terms of male unemployment, the demographic groups most similar to Immigrants from Thailand are Immigrants from Greece (5.4%, a difference of 0.020%), Immigrants from Zaire (5.4%, a difference of 0.12%), Immigrants from Philippines (5.4%, a difference of 0.15%), Nonimmigrants (5.4%, a difference of 0.19%), and Immigrants from Laos (5.4%, a difference of 0.20%).
| Demographics | Rating | Rank | Male Unemployment |
| Immigrants | South Eastern Asia | 28.2 /100 | #191 | Fair 5.4% |
| Immigrants | Belarus | 26.0 /100 | #192 | Fair 5.4% |
| Immigrants | Israel | 25.2 /100 | #193 | Fair 5.4% |
| Spanish | 19.7 /100 | #194 | Poor 5.4% |
| Immigrants | Southern Europe | 17.7 /100 | #195 | Poor 5.4% |
| Albanians | 17.3 /100 | #196 | Poor 5.4% |
| Alsatians | 16.7 /100 | #197 | Poor 5.4% |
| Immigrants | Thailand | 14.7 /100 | #198 | Poor 5.4% |
| Immigrants | Greece | 14.5 /100 | #199 | Poor 5.4% |
| Immigrants | Zaire | 13.7 /100 | #200 | Poor 5.4% |
| Immigrants | Philippines | 13.5 /100 | #201 | Poor 5.4% |
| Immigrants | Nonimmigrants | 13.1 /100 | #202 | Poor 5.4% |
| Immigrants | Laos | 13.0 /100 | #203 | Poor 5.4% |
| Guamanians/Chamorros | 12.3 /100 | #204 | Poor 5.4% |
| Immigrants | Costa Rica | 11.4 /100 | #205 | Poor 5.5% |