Russian vs Immigrants from Caribbean Unemployment Among Women with Children Under 6 years
COMPARE
Russian
Immigrants from Caribbean
Unemployment Among Women with Children Under 6 years
Unemployment Among Women with Children Under 6 years Comparison
Russians
Immigrants from Caribbean
7.2%
UNEMPLOYMENT AMONG WOMEN WITH CHILDREN UNDER 6 YEARS
97.5/ 100
METRIC RATING
98th/ 347
METRIC RANK
8.3%
UNEMPLOYMENT AMONG WOMEN WITH CHILDREN UNDER 6 YEARS
0.7/ 100
METRIC RATING
254th/ 347
METRIC RANK
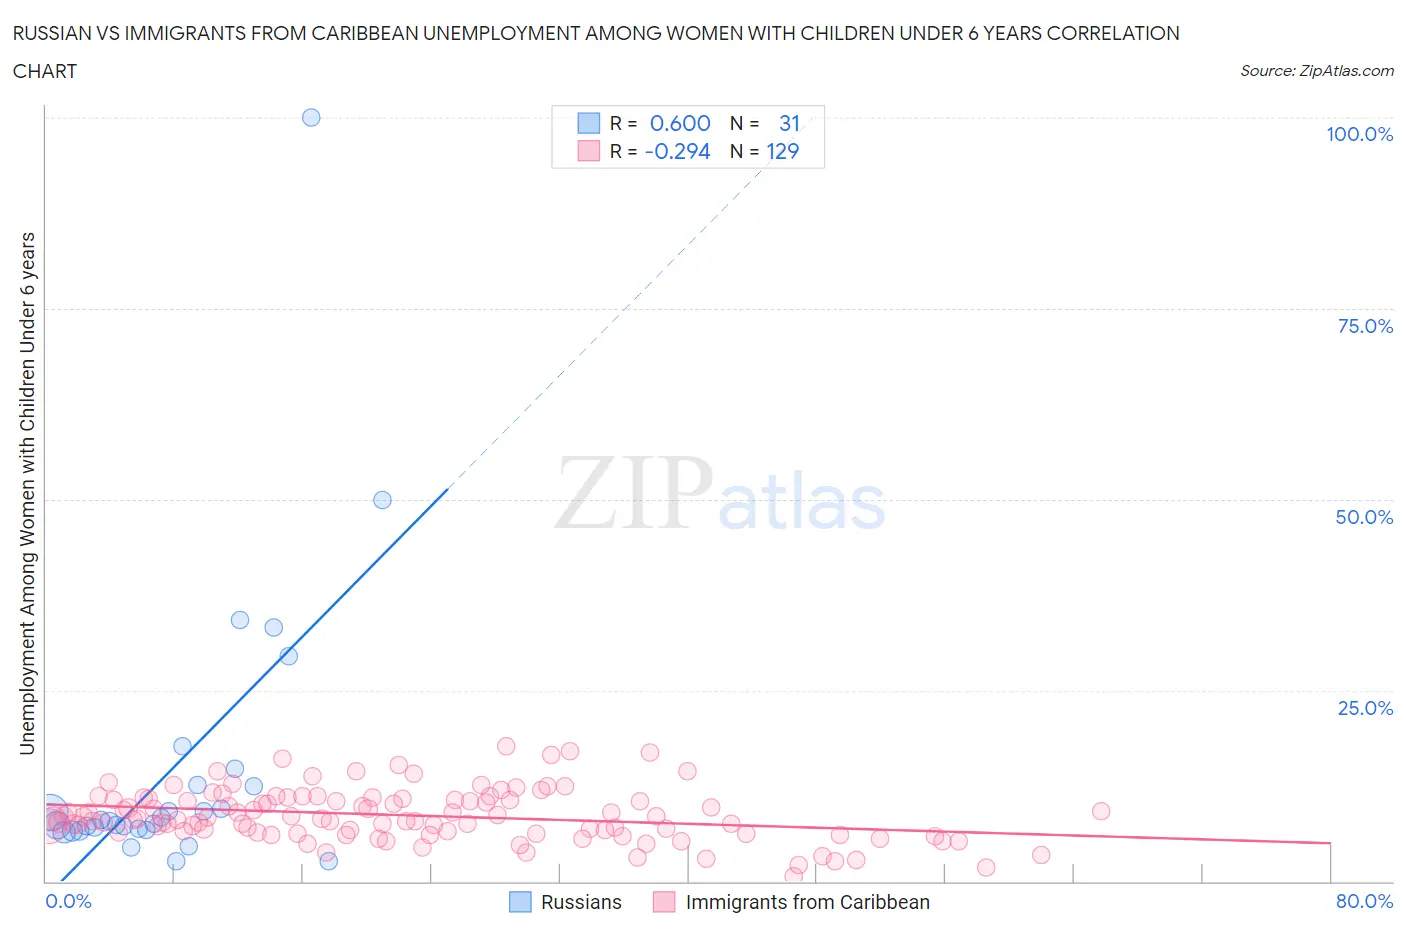
Russian vs Immigrants from Caribbean Unemployment Among Women with Children Under 6 years Correlation Chart
The statistical analysis conducted on geographies consisting of 355,681,111 people shows a substantial positive correlation between the proportion of Russians and unemployment rate among women with children under the age of 6 in the United States with a correlation coefficient (R) of 0.600 and weighted average of 7.2%. Similarly, the statistical analysis conducted on geographies consisting of 333,938,519 people shows a weak negative correlation between the proportion of Immigrants from Caribbean and unemployment rate among women with children under the age of 6 in the United States with a correlation coefficient (R) of -0.294 and weighted average of 8.3%, a difference of 15.2%.
Unemployment Among Women with Children Under 6 years Correlation Summary
| Measurement | Russian | Immigrants from Caribbean |
| Minimum | 2.6% | 0.70% |
| Maximum | 100.0% | 17.6% |
| Range | 97.4% | 16.9% |
| Mean | 14.7% | 8.6% |
| Median | 7.8% | 8.2% |
| Interquartile 25% (IQ1) | 6.7% | 6.4% |
| Interquartile 75% (IQ3) | 12.6% | 10.7% |
| Interquartile Range (IQR) | 5.9% | 4.3% |
| Standard Deviation (Sample) | 19.1% | 3.3% |
| Standard Deviation (Population) | 18.8% | 3.3% |
Similar Demographics by Unemployment Among Women with Children Under 6 years
Demographics Similar to Russians by Unemployment Among Women with Children Under 6 years
In terms of unemployment among women with children under 6 years, the demographic groups most similar to Russians are Immigrants from South Eastern Asia (7.2%, a difference of 0.030%), Immigrants from Europe (7.2%, a difference of 0.040%), Immigrants from Northern Europe (7.2%, a difference of 0.080%), Immigrants from Eastern Africa (7.2%, a difference of 0.11%), and Chilean (7.2%, a difference of 0.11%).
| Demographics | Rating | Rank | Unemployment Among Women with Children Under 6 years |
| Danes | 98.2 /100 | #91 | Exceptional 7.1% |
| Albanians | 98.0 /100 | #92 | Exceptional 7.2% |
| New Zealanders | 97.8 /100 | #93 | Exceptional 7.2% |
| Macedonians | 97.7 /100 | #94 | Exceptional 7.2% |
| Romanians | 97.7 /100 | #95 | Exceptional 7.2% |
| Immigrants | Eastern Africa | 97.7 /100 | #96 | Exceptional 7.2% |
| Immigrants | South Eastern Asia | 97.6 /100 | #97 | Exceptional 7.2% |
| Russians | 97.5 /100 | #98 | Exceptional 7.2% |
| Immigrants | Europe | 97.5 /100 | #99 | Exceptional 7.2% |
| Immigrants | Northern Europe | 97.4 /100 | #100 | Exceptional 7.2% |
| Chileans | 97.4 /100 | #101 | Exceptional 7.2% |
| Immigrants | Nicaragua | 97.3 /100 | #102 | Exceptional 7.2% |
| Immigrants | Saudi Arabia | 97.3 /100 | #103 | Exceptional 7.2% |
| Immigrants | Egypt | 97.2 /100 | #104 | Exceptional 7.2% |
| Venezuelans | 97.2 /100 | #105 | Exceptional 7.2% |
Demographics Similar to Immigrants from Caribbean by Unemployment Among Women with Children Under 6 years
In terms of unemployment among women with children under 6 years, the demographic groups most similar to Immigrants from Caribbean are Immigrants from Guyana (8.2%, a difference of 0.27%), Immigrants from Portugal (8.3%, a difference of 0.29%), Celtic (8.3%, a difference of 0.31%), Guyanese (8.2%, a difference of 0.44%), and Ghanaian (8.2%, a difference of 0.44%).
| Demographics | Rating | Rank | Unemployment Among Women with Children Under 6 years |
| German Russians | 1.2 /100 | #247 | Tragic 8.2% |
| Immigrants | Western Africa | 1.1 /100 | #248 | Tragic 8.2% |
| Immigrants | Sierra Leone | 1.1 /100 | #249 | Tragic 8.2% |
| Nigerians | 1.1 /100 | #250 | Tragic 8.2% |
| Guyanese | 1.0 /100 | #251 | Tragic 8.2% |
| Ghanaians | 1.0 /100 | #252 | Tragic 8.2% |
| Immigrants | Guyana | 0.8 /100 | #253 | Tragic 8.2% |
| Immigrants | Caribbean | 0.7 /100 | #254 | Tragic 8.3% |
| Immigrants | Portugal | 0.6 /100 | #255 | Tragic 8.3% |
| Celtics | 0.6 /100 | #256 | Tragic 8.3% |
| British West Indians | 0.5 /100 | #257 | Tragic 8.3% |
| Immigrants | Ghana | 0.5 /100 | #258 | Tragic 8.3% |
| Barbadians | 0.4 /100 | #259 | Tragic 8.3% |
| Whites/Caucasians | 0.3 /100 | #260 | Tragic 8.4% |
| Immigrants | Liberia | 0.3 /100 | #261 | Tragic 8.4% |