European vs Welsh Unemployment Among Women with Children Under 6 years
COMPARE
European
Welsh
Unemployment Among Women with Children Under 6 years
Unemployment Among Women with Children Under 6 years Comparison
Europeans
Welsh
7.5%
UNEMPLOYMENT AMONG WOMEN WITH CHILDREN UNDER 6 YEARS
79.1/ 100
METRIC RATING
144th/ 347
METRIC RANK
8.0%
UNEMPLOYMENT AMONG WOMEN WITH CHILDREN UNDER 6 YEARS
5.0/ 100
METRIC RATING
232nd/ 347
METRIC RANK
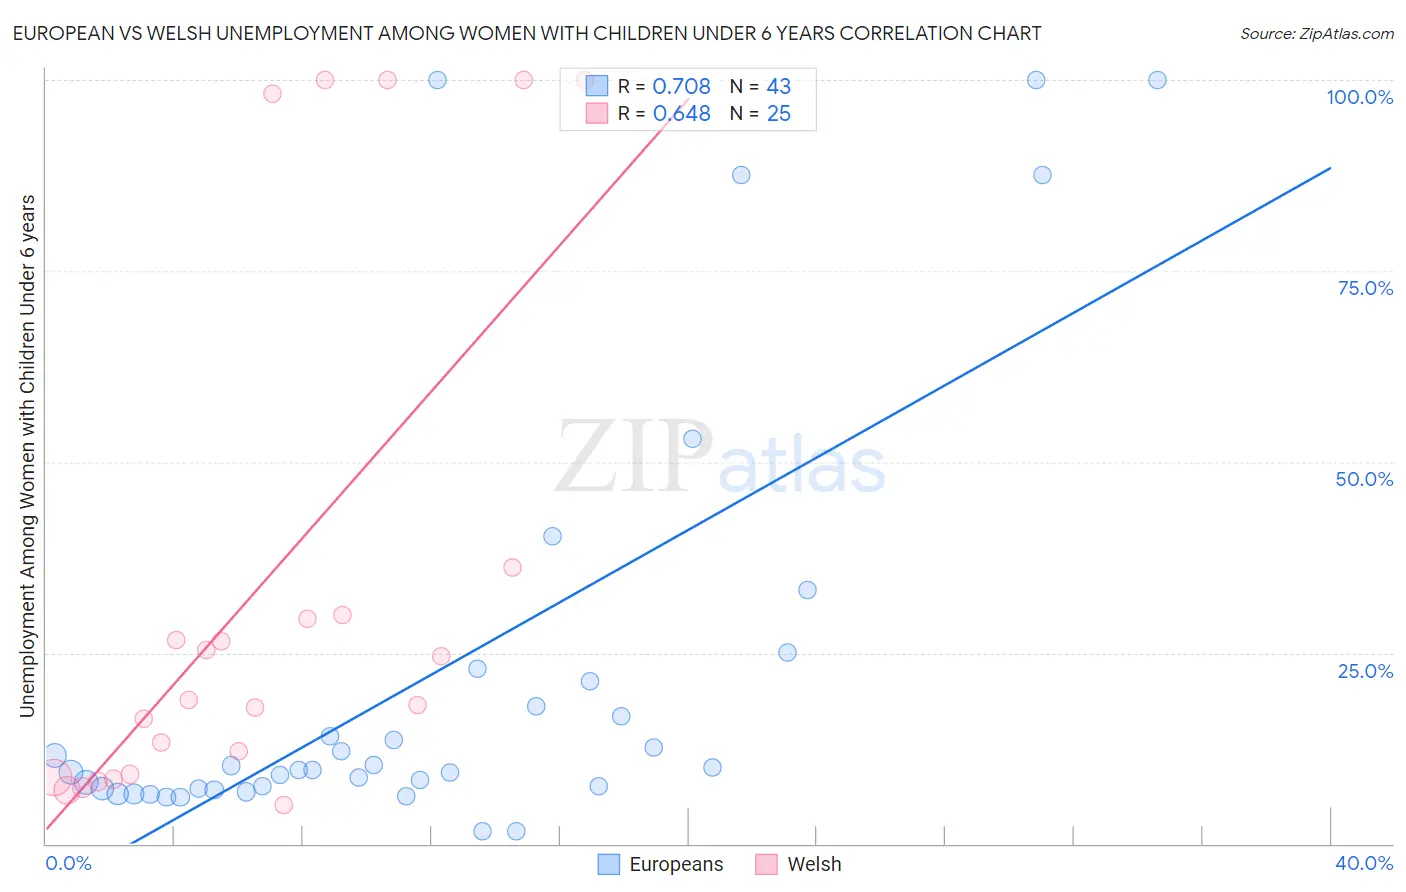
European vs Welsh Unemployment Among Women with Children Under 6 years Correlation Chart
The statistical analysis conducted on geographies consisting of 373,796,312 people shows a strong positive correlation between the proportion of Europeans and unemployment rate among women with children under the age of 6 in the United States with a correlation coefficient (R) of 0.708 and weighted average of 7.5%. Similarly, the statistical analysis conducted on geographies consisting of 357,262,742 people shows a significant positive correlation between the proportion of Welsh and unemployment rate among women with children under the age of 6 in the United States with a correlation coefficient (R) of 0.648 and weighted average of 8.0%, a difference of 7.2%.
Unemployment Among Women with Children Under 6 years Correlation Summary
| Measurement | European | Welsh |
| Minimum | 1.6% | 5.1% |
| Maximum | 100.0% | 100.0% |
| Range | 98.4% | 94.9% |
| Mean | 22.3% | 33.9% |
| Median | 9.7% | 18.8% |
| Interquartile 25% (IQ1) | 7.2% | 8.9% |
| Interquartile 75% (IQ3) | 21.3% | 33.0% |
| Interquartile Range (IQR) | 14.1% | 24.2% |
| Standard Deviation (Sample) | 28.5% | 34.6% |
| Standard Deviation (Population) | 28.2% | 33.9% |
Similar Demographics by Unemployment Among Women with Children Under 6 years
Demographics Similar to Europeans by Unemployment Among Women with Children Under 6 years
In terms of unemployment among women with children under 6 years, the demographic groups most similar to Europeans are Immigrants from Jordan (7.5%, a difference of 0.030%), Japanese (7.5%, a difference of 0.030%), Immigrants from Oceania (7.5%, a difference of 0.070%), Immigrants from Brazil (7.5%, a difference of 0.18%), and Korean (7.5%, a difference of 0.24%).
| Demographics | Rating | Rank | Unemployment Among Women with Children Under 6 years |
| Immigrants | Cambodia | 84.6 /100 | #137 | Excellent 7.4% |
| Immigrants | Norway | 84.1 /100 | #138 | Excellent 7.4% |
| Immigrants | Colombia | 83.9 /100 | #139 | Excellent 7.4% |
| Scandinavians | 83.0 /100 | #140 | Excellent 7.4% |
| Greeks | 82.6 /100 | #141 | Excellent 7.4% |
| Immigrants | Argentina | 81.5 /100 | #142 | Excellent 7.5% |
| Koreans | 81.3 /100 | #143 | Excellent 7.5% |
| Europeans | 79.1 /100 | #144 | Good 7.5% |
| Immigrants | Jordan | 78.9 /100 | #145 | Good 7.5% |
| Japanese | 78.9 /100 | #146 | Good 7.5% |
| Immigrants | Oceania | 78.4 /100 | #147 | Good 7.5% |
| Immigrants | Brazil | 77.3 /100 | #148 | Good 7.5% |
| Colombians | 76.1 /100 | #149 | Good 7.5% |
| Aleuts | 76.0 /100 | #150 | Good 7.5% |
| Immigrants | Peru | 74.9 /100 | #151 | Good 7.5% |
Demographics Similar to Welsh by Unemployment Among Women with Children Under 6 years
In terms of unemployment among women with children under 6 years, the demographic groups most similar to Welsh are Finnish (8.0%, a difference of 0.090%), Trinidadian and Tobagonian (8.0%, a difference of 0.090%), Immigrants from Trinidad and Tobago (8.0%, a difference of 0.090%), Salvadoran (8.0%, a difference of 0.16%), and Kiowa (8.0%, a difference of 0.23%).
| Demographics | Rating | Rank | Unemployment Among Women with Children Under 6 years |
| Germans | 7.0 /100 | #225 | Tragic 8.0% |
| Senegalese | 6.2 /100 | #226 | Tragic 8.0% |
| Portuguese | 6.2 /100 | #227 | Tragic 8.0% |
| Immigrants | Sudan | 6.0 /100 | #228 | Tragic 8.0% |
| Salvadorans | 5.5 /100 | #229 | Tragic 8.0% |
| Finns | 5.3 /100 | #230 | Tragic 8.0% |
| Trinidadians and Tobagonians | 5.3 /100 | #231 | Tragic 8.0% |
| Welsh | 5.0 /100 | #232 | Tragic 8.0% |
| Immigrants | Trinidad and Tobago | 4.8 /100 | #233 | Tragic 8.0% |
| Kiowa | 4.4 /100 | #234 | Tragic 8.0% |
| Comanche | 4.3 /100 | #235 | Tragic 8.0% |
| Immigrants | Barbados | 4.2 /100 | #236 | Tragic 8.0% |
| Immigrants | Costa Rica | 4.1 /100 | #237 | Tragic 8.0% |
| Immigrants | Middle Africa | 3.2 /100 | #238 | Tragic 8.1% |
| Irish | 2.7 /100 | #239 | Tragic 8.1% |