Immigrants from Serbia vs Immigrants from Caribbean Unemployment Among Women with Children Under 6 years
COMPARE
Immigrants from Serbia
Immigrants from Caribbean
Unemployment Among Women with Children Under 6 years
Unemployment Among Women with Children Under 6 years Comparison
Immigrants from Serbia
Immigrants from Caribbean
6.9%
UNEMPLOYMENT AMONG WOMEN WITH CHILDREN UNDER 6 YEARS
99.8/ 100
METRIC RATING
59th/ 347
METRIC RANK
8.3%
UNEMPLOYMENT AMONG WOMEN WITH CHILDREN UNDER 6 YEARS
0.7/ 100
METRIC RATING
254th/ 347
METRIC RANK
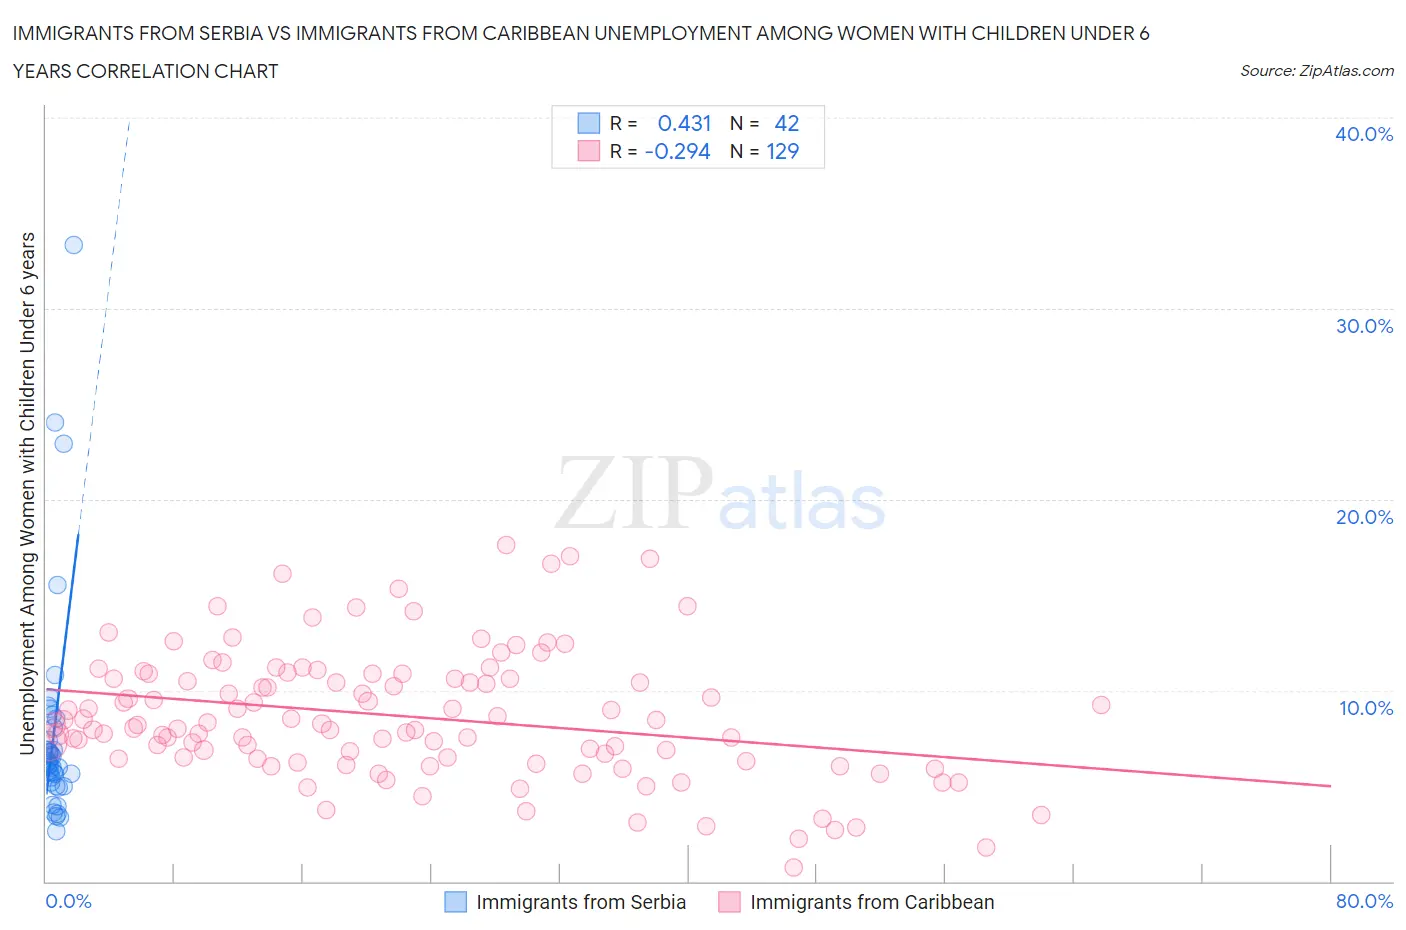
Immigrants from Serbia vs Immigrants from Caribbean Unemployment Among Women with Children Under 6 years Correlation Chart
The statistical analysis conducted on geographies consisting of 114,667,265 people shows a moderate positive correlation between the proportion of Immigrants from Serbia and unemployment rate among women with children under the age of 6 in the United States with a correlation coefficient (R) of 0.431 and weighted average of 6.9%. Similarly, the statistical analysis conducted on geographies consisting of 333,938,519 people shows a weak negative correlation between the proportion of Immigrants from Caribbean and unemployment rate among women with children under the age of 6 in the United States with a correlation coefficient (R) of -0.294 and weighted average of 8.3%, a difference of 20.3%.
Unemployment Among Women with Children Under 6 years Correlation Summary
| Measurement | Immigrants from Serbia | Immigrants from Caribbean |
| Minimum | 2.6% | 0.70% |
| Maximum | 33.3% | 17.6% |
| Range | 30.7% | 16.9% |
| Mean | 7.8% | 8.6% |
| Median | 6.2% | 8.2% |
| Interquartile 25% (IQ1) | 5.1% | 6.4% |
| Interquartile 75% (IQ3) | 8.1% | 10.7% |
| Interquartile Range (IQR) | 2.9% | 4.3% |
| Standard Deviation (Sample) | 5.9% | 3.3% |
| Standard Deviation (Population) | 5.8% | 3.3% |
Similar Demographics by Unemployment Among Women with Children Under 6 years
Demographics Similar to Immigrants from Serbia by Unemployment Among Women with Children Under 6 years
In terms of unemployment among women with children under 6 years, the demographic groups most similar to Immigrants from Serbia are Immigrants from Turkey (6.9%, a difference of 0.070%), Immigrants from Sri Lanka (6.9%, a difference of 0.080%), Icelander (6.9%, a difference of 0.29%), Immigrants from Ethiopia (6.9%, a difference of 0.30%), and Immigrants from Ukraine (6.8%, a difference of 0.40%).
| Demographics | Rating | Rank | Unemployment Among Women with Children Under 6 years |
| Immigrants | Iran | 99.9 /100 | #52 | Exceptional 6.8% |
| Chinese | 99.9 /100 | #53 | Exceptional 6.8% |
| Immigrants | Latvia | 99.9 /100 | #54 | Exceptional 6.8% |
| Immigrants | Ukraine | 99.8 /100 | #55 | Exceptional 6.8% |
| Immigrants | Ethiopia | 99.8 /100 | #56 | Exceptional 6.9% |
| Icelanders | 99.8 /100 | #57 | Exceptional 6.9% |
| Immigrants | Turkey | 99.8 /100 | #58 | Exceptional 6.9% |
| Immigrants | Serbia | 99.8 /100 | #59 | Exceptional 6.9% |
| Immigrants | Sri Lanka | 99.8 /100 | #60 | Exceptional 6.9% |
| Immigrants | France | 99.7 /100 | #61 | Exceptional 6.9% |
| Somalis | 99.7 /100 | #62 | Exceptional 6.9% |
| Maltese | 99.7 /100 | #63 | Exceptional 6.9% |
| Tongans | 99.7 /100 | #64 | Exceptional 6.9% |
| Immigrants | Kuwait | 99.7 /100 | #65 | Exceptional 6.9% |
| Immigrants | Belgium | 99.6 /100 | #66 | Exceptional 6.9% |
Demographics Similar to Immigrants from Caribbean by Unemployment Among Women with Children Under 6 years
In terms of unemployment among women with children under 6 years, the demographic groups most similar to Immigrants from Caribbean are Immigrants from Guyana (8.2%, a difference of 0.27%), Immigrants from Portugal (8.3%, a difference of 0.29%), Celtic (8.3%, a difference of 0.31%), Guyanese (8.2%, a difference of 0.44%), and Ghanaian (8.2%, a difference of 0.44%).
| Demographics | Rating | Rank | Unemployment Among Women with Children Under 6 years |
| German Russians | 1.2 /100 | #247 | Tragic 8.2% |
| Immigrants | Western Africa | 1.1 /100 | #248 | Tragic 8.2% |
| Immigrants | Sierra Leone | 1.1 /100 | #249 | Tragic 8.2% |
| Nigerians | 1.1 /100 | #250 | Tragic 8.2% |
| Guyanese | 1.0 /100 | #251 | Tragic 8.2% |
| Ghanaians | 1.0 /100 | #252 | Tragic 8.2% |
| Immigrants | Guyana | 0.8 /100 | #253 | Tragic 8.2% |
| Immigrants | Caribbean | 0.7 /100 | #254 | Tragic 8.3% |
| Immigrants | Portugal | 0.6 /100 | #255 | Tragic 8.3% |
| Celtics | 0.6 /100 | #256 | Tragic 8.3% |
| British West Indians | 0.5 /100 | #257 | Tragic 8.3% |
| Immigrants | Ghana | 0.5 /100 | #258 | Tragic 8.3% |
| Barbadians | 0.4 /100 | #259 | Tragic 8.3% |
| Whites/Caucasians | 0.3 /100 | #260 | Tragic 8.4% |
| Immigrants | Liberia | 0.3 /100 | #261 | Tragic 8.4% |