European vs Cypriot Unemployment
COMPARE
European
Cypriot
Unemployment
Unemployment Comparison
Europeans
Cypriots
4.6%
UNEMPLOYMENT
99.9/ 100
METRIC RATING
15th/ 347
METRIC RANK
4.9%
UNEMPLOYMENT
97.9/ 100
METRIC RATING
77th/ 347
METRIC RANK
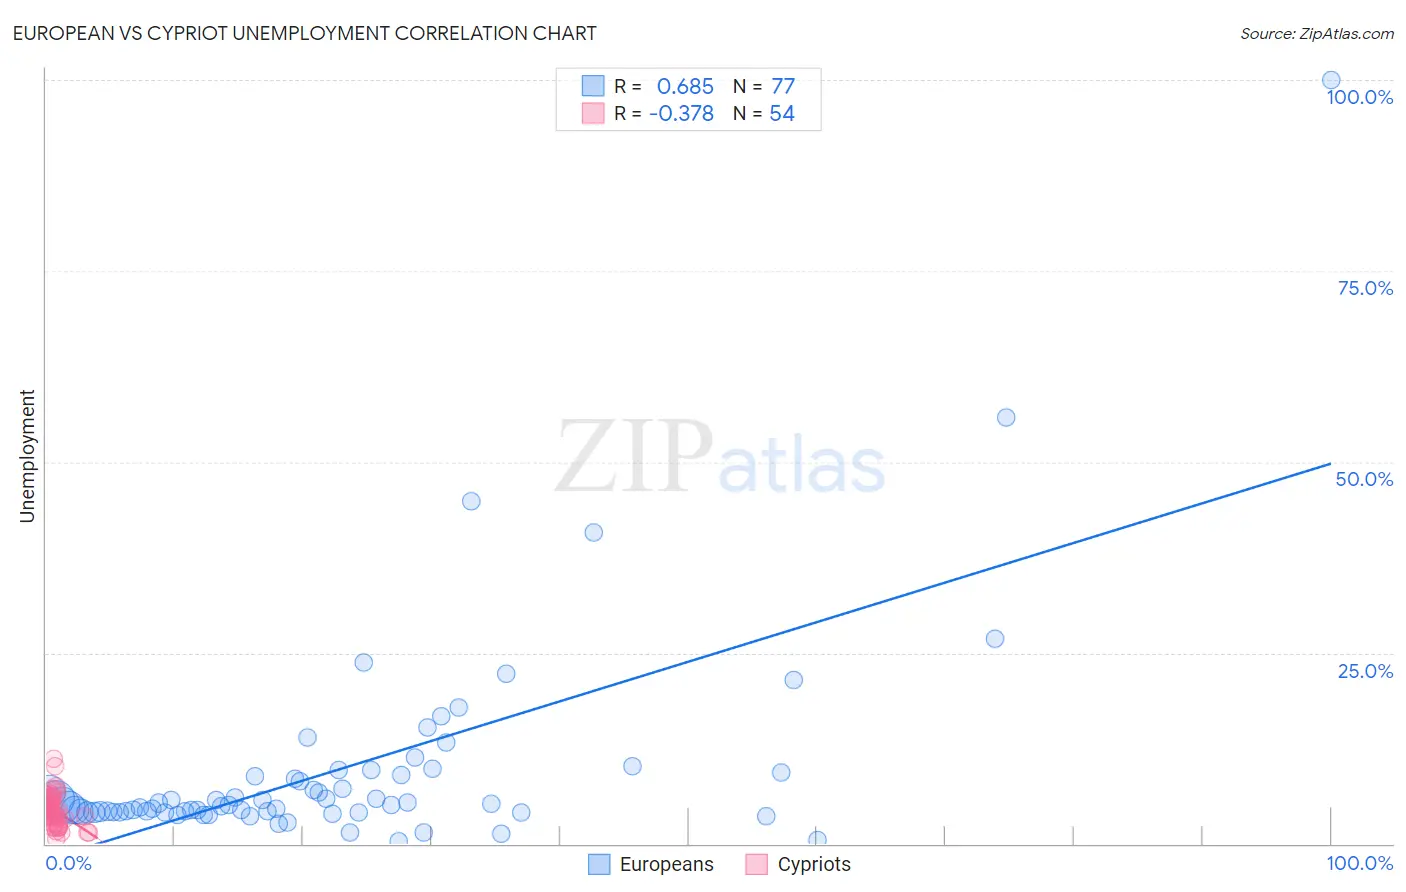
European vs Cypriot Unemployment Correlation Chart
The statistical analysis conducted on geographies consisting of 558,532,246 people shows a significant positive correlation between the proportion of Europeans and unemployment in the United States with a correlation coefficient (R) of 0.685 and weighted average of 4.6%. Similarly, the statistical analysis conducted on geographies consisting of 61,864,376 people shows a mild negative correlation between the proportion of Cypriots and unemployment in the United States with a correlation coefficient (R) of -0.378 and weighted average of 4.9%, a difference of 6.5%.
Unemployment Correlation Summary
| Measurement | European | Cypriot |
| Minimum | 0.40% | 0.70% |
| Maximum | 100.0% | 11.2% |
| Range | 99.6% | 10.5% |
| Mean | 9.7% | 4.4% |
| Median | 5.0% | 4.4% |
| Interquartile 25% (IQ1) | 4.2% | 3.3% |
| Interquartile 75% (IQ3) | 9.2% | 5.4% |
| Interquartile Range (IQR) | 5.0% | 2.1% |
| Standard Deviation (Sample) | 14.1% | 2.0% |
| Standard Deviation (Population) | 14.0% | 2.0% |
Similar Demographics by Unemployment
Demographics Similar to Europeans by Unemployment
In terms of unemployment, the demographic groups most similar to Europeans are Chinese (4.7%, a difference of 0.14%), Slovene (4.7%, a difference of 0.24%), Immigrants from Venezuela (4.7%, a difference of 0.27%), Scottish (4.7%, a difference of 0.35%), and Immigrants from Cuba (4.6%, a difference of 0.48%).
| Demographics | Rating | Rank | Unemployment |
| Swiss | 100.0 /100 | #8 | Exceptional 4.5% |
| Scandinavians | 100.0 /100 | #9 | Exceptional 4.5% |
| Dutch | 100.0 /100 | #10 | Exceptional 4.6% |
| English | 100.0 /100 | #11 | Exceptional 4.6% |
| Pennsylvania Germans | 100.0 /100 | #12 | Exceptional 4.6% |
| Belgians | 100.0 /100 | #13 | Exceptional 4.6% |
| Immigrants | Cuba | 100.0 /100 | #14 | Exceptional 4.6% |
| Europeans | 99.9 /100 | #15 | Exceptional 4.6% |
| Chinese | 99.9 /100 | #16 | Exceptional 4.7% |
| Slovenes | 99.9 /100 | #17 | Exceptional 4.7% |
| Immigrants | Venezuela | 99.9 /100 | #18 | Exceptional 4.7% |
| Scottish | 99.9 /100 | #19 | Exceptional 4.7% |
| Carpatho Rusyns | 99.9 /100 | #20 | Exceptional 4.7% |
| Welsh | 99.9 /100 | #21 | Exceptional 4.7% |
| Thais | 99.9 /100 | #22 | Exceptional 4.7% |
Demographics Similar to Cypriots by Unemployment
In terms of unemployment, the demographic groups most similar to Cypriots are Okinawan (4.9%, a difference of 0.040%), German Russian (4.9%, a difference of 0.060%), Turkish (4.9%, a difference of 0.080%), Canadian (5.0%, a difference of 0.16%), and Immigrants from Northern Europe (4.9%, a difference of 0.22%).
| Demographics | Rating | Rank | Unemployment |
| Serbians | 98.4 /100 | #70 | Exceptional 4.9% |
| Immigrants | Japan | 98.3 /100 | #71 | Exceptional 4.9% |
| Burmese | 98.3 /100 | #72 | Exceptional 4.9% |
| Paraguayans | 98.3 /100 | #73 | Exceptional 4.9% |
| Immigrants | Northern Europe | 98.2 /100 | #74 | Exceptional 4.9% |
| Turks | 98.0 /100 | #75 | Exceptional 4.9% |
| German Russians | 98.0 /100 | #76 | Exceptional 4.9% |
| Cypriots | 97.9 /100 | #77 | Exceptional 4.9% |
| Okinawans | 97.9 /100 | #78 | Exceptional 4.9% |
| Canadians | 97.7 /100 | #79 | Exceptional 5.0% |
| Immigrants | Sweden | 97.6 /100 | #80 | Exceptional 5.0% |
| Basques | 97.6 /100 | #81 | Exceptional 5.0% |
| Fijians | 97.6 /100 | #82 | Exceptional 5.0% |
| Hmong | 97.6 /100 | #83 | Exceptional 5.0% |
| Russians | 97.4 /100 | #84 | Exceptional 5.0% |