Immigrants from Asia vs Ottawa Male Unemployment
COMPARE
Immigrants from Asia
Ottawa
Male Unemployment
Male Unemployment Comparison
Immigrants from Asia
Ottawa
5.1%
MALE UNEMPLOYMENT
89.6/ 100
METRIC RATING
115th/ 347
METRIC RANK
5.7%
MALE UNEMPLOYMENT
0.9/ 100
METRIC RATING
242nd/ 347
METRIC RANK
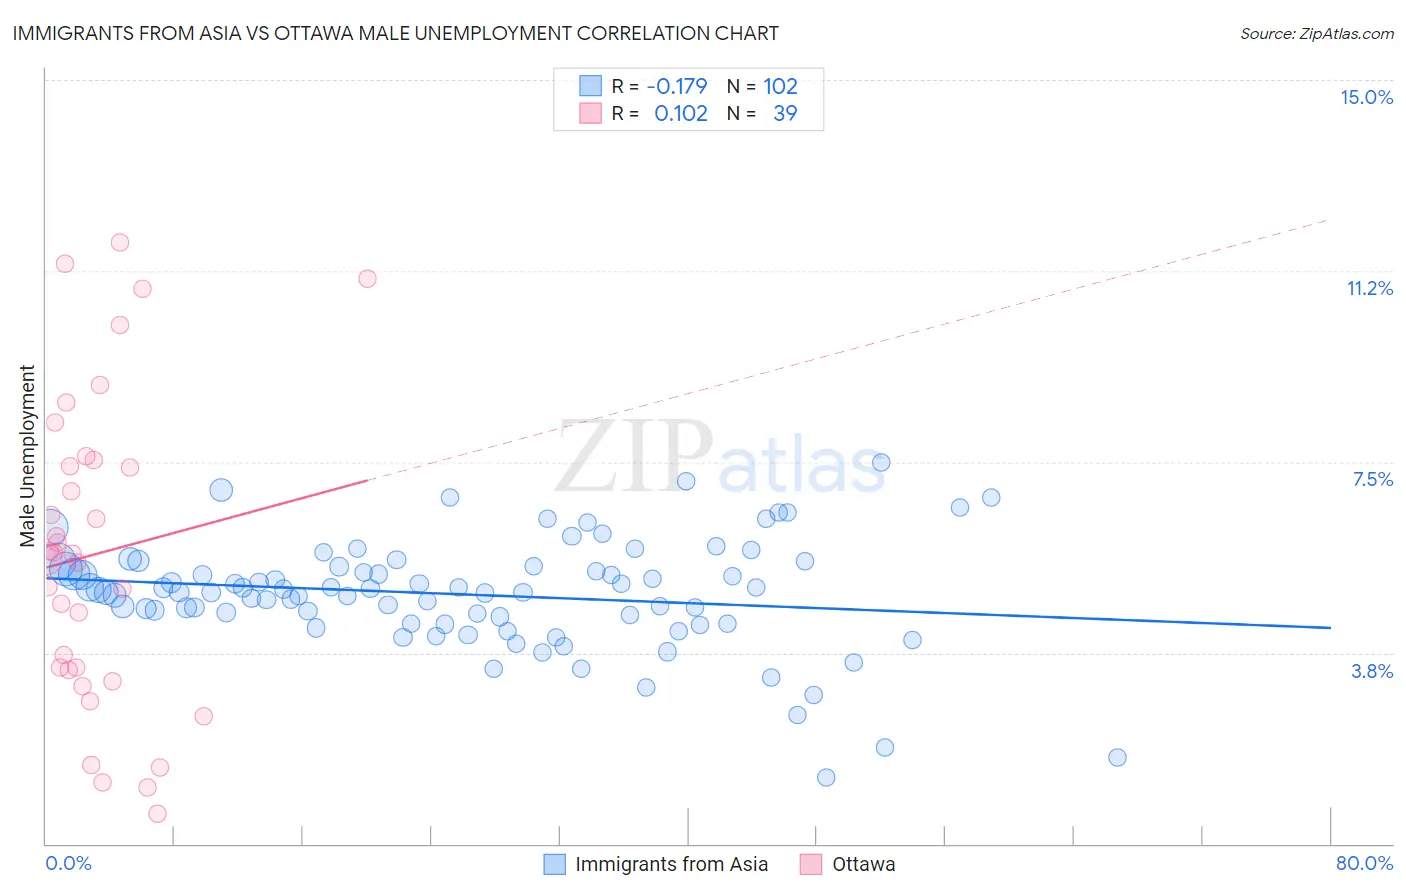
Immigrants from Asia vs Ottawa Male Unemployment Correlation Chart
The statistical analysis conducted on geographies consisting of 542,340,626 people shows a poor negative correlation between the proportion of Immigrants from Asia and unemployment rate among males in the United States with a correlation coefficient (R) of -0.179 and weighted average of 5.1%. Similarly, the statistical analysis conducted on geographies consisting of 49,911,932 people shows a poor positive correlation between the proportion of Ottawa and unemployment rate among males in the United States with a correlation coefficient (R) of 0.102 and weighted average of 5.7%, a difference of 10.3%.
Male Unemployment Correlation Summary
| Measurement | Immigrants from Asia | Ottawa |
| Minimum | 1.3% | 0.60% |
| Maximum | 7.5% | 11.8% |
| Range | 6.2% | 11.2% |
| Mean | 4.9% | 5.7% |
| Median | 5.0% | 5.7% |
| Interquartile 25% (IQ1) | 4.3% | 3.4% |
| Interquartile 75% (IQ3) | 5.4% | 7.5% |
| Interquartile Range (IQR) | 1.1% | 4.1% |
| Standard Deviation (Sample) | 1.1% | 3.0% |
| Standard Deviation (Population) | 1.1% | 3.0% |
Similar Demographics by Male Unemployment
Demographics Similar to Immigrants from Asia by Male Unemployment
In terms of male unemployment, the demographic groups most similar to Immigrants from Asia are Romanian (5.1%, a difference of 0.030%), Immigrants from Denmark (5.1%, a difference of 0.040%), Estonian (5.1%, a difference of 0.090%), Immigrants from Moldova (5.1%, a difference of 0.11%), and Immigrants from Austria (5.1%, a difference of 0.11%).
| Demographics | Rating | Rank | Male Unemployment |
| Immigrants | Nicaragua | 91.2 /100 | #108 | Exceptional 5.1% |
| Immigrants | Pakistan | 90.9 /100 | #109 | Exceptional 5.1% |
| Immigrants | England | 90.8 /100 | #110 | Exceptional 5.1% |
| Immigrants | Eastern Asia | 90.8 /100 | #111 | Exceptional 5.1% |
| Immigrants | Moldova | 90.3 /100 | #112 | Exceptional 5.1% |
| Immigrants | Austria | 90.3 /100 | #113 | Exceptional 5.1% |
| Romanians | 89.8 /100 | #114 | Excellent 5.1% |
| Immigrants | Asia | 89.6 /100 | #115 | Excellent 5.1% |
| Immigrants | Denmark | 89.4 /100 | #116 | Excellent 5.1% |
| Estonians | 89.0 /100 | #117 | Excellent 5.1% |
| Cypriots | 88.8 /100 | #118 | Excellent 5.1% |
| French Canadians | 88.6 /100 | #119 | Excellent 5.1% |
| Ukrainians | 88.4 /100 | #120 | Excellent 5.1% |
| Mongolians | 88.4 /100 | #121 | Excellent 5.1% |
| Nicaraguans | 88.2 /100 | #122 | Excellent 5.1% |
Demographics Similar to Ottawa by Male Unemployment
In terms of male unemployment, the demographic groups most similar to Ottawa are Salvadoran (5.7%, a difference of 0.070%), Immigrants from Cameroon (5.6%, a difference of 0.11%), Immigrants from Guatemala (5.6%, a difference of 0.18%), Native Hawaiian (5.6%, a difference of 0.19%), and Honduran (5.6%, a difference of 0.23%).
| Demographics | Rating | Rank | Male Unemployment |
| Immigrants | Honduras | 1.5 /100 | #235 | Tragic 5.6% |
| Guatemalans | 1.2 /100 | #236 | Tragic 5.6% |
| Hondurans | 1.1 /100 | #237 | Tragic 5.6% |
| Native Hawaiians | 1.1 /100 | #238 | Tragic 5.6% |
| Immigrants | Guatemala | 1.1 /100 | #239 | Tragic 5.6% |
| Immigrants | Cameroon | 1.0 /100 | #240 | Tragic 5.6% |
| Salvadorans | 1.0 /100 | #241 | Tragic 5.7% |
| Ottawa | 0.9 /100 | #242 | Tragic 5.7% |
| Bangladeshis | 0.8 /100 | #243 | Tragic 5.7% |
| Immigrants | El Salvador | 0.7 /100 | #244 | Tragic 5.7% |
| Yaqui | 0.7 /100 | #245 | Tragic 5.7% |
| Iroquois | 0.6 /100 | #246 | Tragic 5.7% |
| Hawaiians | 0.6 /100 | #247 | Tragic 5.7% |
| Marshallese | 0.5 /100 | #248 | Tragic 5.7% |
| Cree | 0.4 /100 | #249 | Tragic 5.7% |