Finnish vs Ottawa Male Unemployment
COMPARE
Finnish
Ottawa
Male Unemployment
Male Unemployment Comparison
Finns
Ottawa
5.0%
MALE UNEMPLOYMENT
97.5/ 100
METRIC RATING
66th/ 347
METRIC RANK
5.7%
MALE UNEMPLOYMENT
0.9/ 100
METRIC RATING
242nd/ 347
METRIC RANK
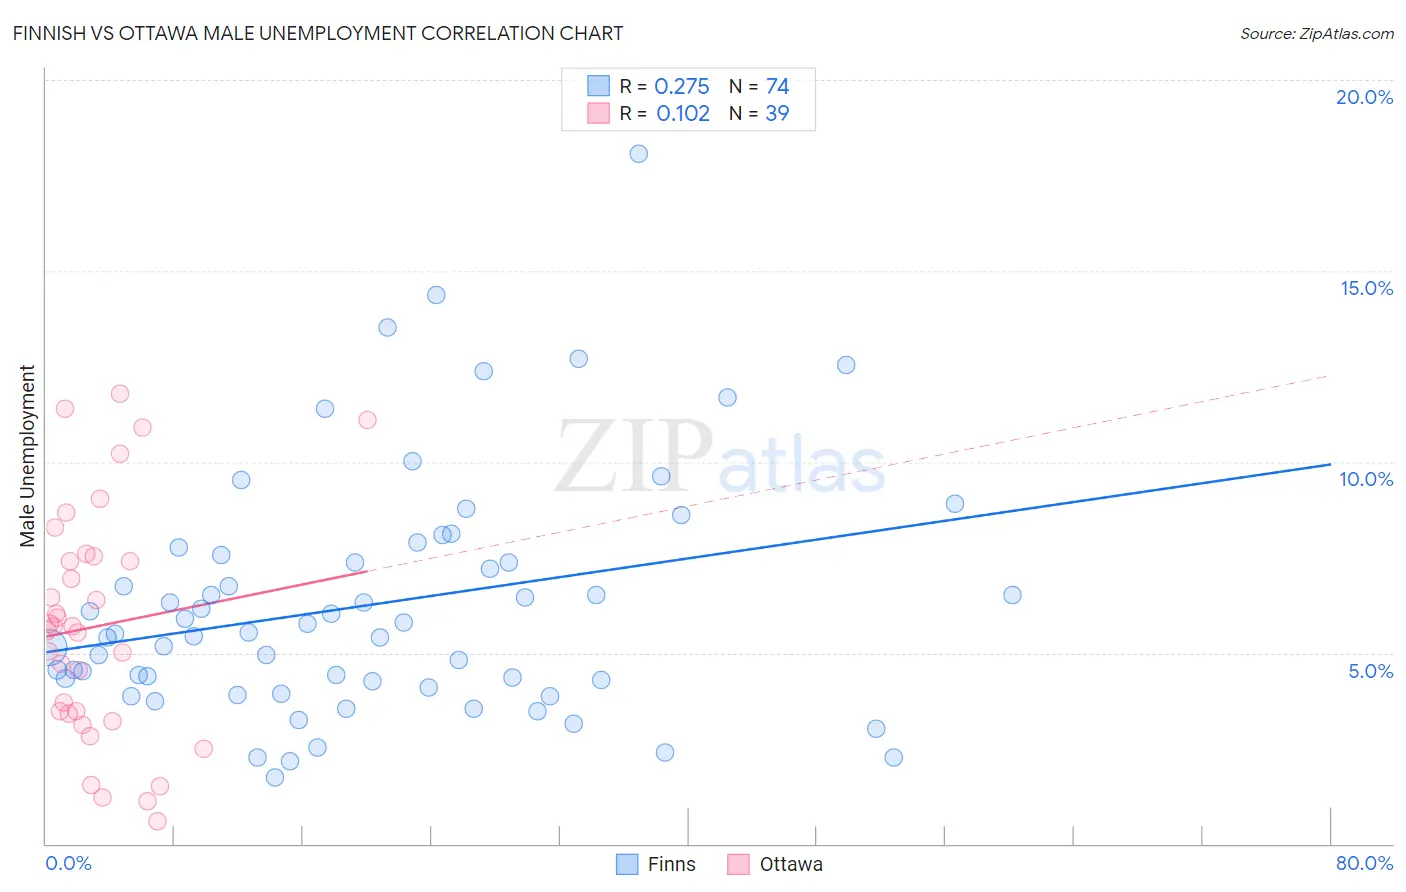
Finnish vs Ottawa Male Unemployment Correlation Chart
The statistical analysis conducted on geographies consisting of 401,956,415 people shows a weak positive correlation between the proportion of Finns and unemployment rate among males in the United States with a correlation coefficient (R) of 0.275 and weighted average of 5.0%. Similarly, the statistical analysis conducted on geographies consisting of 49,911,932 people shows a poor positive correlation between the proportion of Ottawa and unemployment rate among males in the United States with a correlation coefficient (R) of 0.102 and weighted average of 5.7%, a difference of 12.8%.
Male Unemployment Correlation Summary
| Measurement | Finnish | Ottawa |
| Minimum | 1.7% | 0.60% |
| Maximum | 18.1% | 11.8% |
| Range | 16.3% | 11.2% |
| Mean | 6.3% | 5.7% |
| Median | 5.5% | 5.7% |
| Interquartile 25% (IQ1) | 4.3% | 3.4% |
| Interquartile 75% (IQ3) | 7.6% | 7.5% |
| Interquartile Range (IQR) | 3.3% | 4.1% |
| Standard Deviation (Sample) | 3.2% | 3.0% |
| Standard Deviation (Population) | 3.2% | 3.0% |
Similar Demographics by Male Unemployment
Demographics Similar to Finns by Male Unemployment
In terms of male unemployment, the demographic groups most similar to Finns are Immigrants from Canada (5.0%, a difference of 0.020%), Australian (5.0%, a difference of 0.030%), Immigrants from Sweden (5.0%, a difference of 0.060%), Icelander (5.0%, a difference of 0.090%), and White/Caucasian (5.0%, a difference of 0.11%).
| Demographics | Rating | Rank | Male Unemployment |
| Immigrants | Netherlands | 98.3 /100 | #59 | Exceptional 5.0% |
| Immigrants | Argentina | 98.1 /100 | #60 | Exceptional 5.0% |
| Cambodians | 98.1 /100 | #61 | Exceptional 5.0% |
| Basques | 97.9 /100 | #62 | Exceptional 5.0% |
| Eastern Europeans | 97.9 /100 | #63 | Exceptional 5.0% |
| Celtics | 97.8 /100 | #64 | Exceptional 5.0% |
| Icelanders | 97.6 /100 | #65 | Exceptional 5.0% |
| Finns | 97.5 /100 | #66 | Exceptional 5.0% |
| Immigrants | Canada | 97.5 /100 | #67 | Exceptional 5.0% |
| Australians | 97.4 /100 | #68 | Exceptional 5.0% |
| Immigrants | Sweden | 97.4 /100 | #69 | Exceptional 5.0% |
| Whites/Caucasians | 97.3 /100 | #70 | Exceptional 5.0% |
| New Zealanders | 97.3 /100 | #71 | Exceptional 5.0% |
| Immigrants | South Africa | 97.1 /100 | #72 | Exceptional 5.0% |
| Greeks | 97.0 /100 | #73 | Exceptional 5.0% |
Demographics Similar to Ottawa by Male Unemployment
In terms of male unemployment, the demographic groups most similar to Ottawa are Salvadoran (5.7%, a difference of 0.070%), Immigrants from Cameroon (5.6%, a difference of 0.11%), Immigrants from Guatemala (5.6%, a difference of 0.18%), Native Hawaiian (5.6%, a difference of 0.19%), and Honduran (5.6%, a difference of 0.23%).
| Demographics | Rating | Rank | Male Unemployment |
| Immigrants | Honduras | 1.5 /100 | #235 | Tragic 5.6% |
| Guatemalans | 1.2 /100 | #236 | Tragic 5.6% |
| Hondurans | 1.1 /100 | #237 | Tragic 5.6% |
| Native Hawaiians | 1.1 /100 | #238 | Tragic 5.6% |
| Immigrants | Guatemala | 1.1 /100 | #239 | Tragic 5.6% |
| Immigrants | Cameroon | 1.0 /100 | #240 | Tragic 5.6% |
| Salvadorans | 1.0 /100 | #241 | Tragic 5.7% |
| Ottawa | 0.9 /100 | #242 | Tragic 5.7% |
| Bangladeshis | 0.8 /100 | #243 | Tragic 5.7% |
| Immigrants | El Salvador | 0.7 /100 | #244 | Tragic 5.7% |
| Yaqui | 0.7 /100 | #245 | Tragic 5.7% |
| Iroquois | 0.6 /100 | #246 | Tragic 5.7% |
| Hawaiians | 0.6 /100 | #247 | Tragic 5.7% |
| Marshallese | 0.5 /100 | #248 | Tragic 5.7% |
| Cree | 0.4 /100 | #249 | Tragic 5.7% |