Blackfeet vs Kenyan Unemployment Among Women with Children Ages 6 to 17 years
COMPARE
Blackfeet
Kenyan
Unemployment Among Women with Children Ages 6 to 17 years
Unemployment Among Women with Children Ages 6 to 17 years Comparison
Blackfeet
Kenyans
9.6%
UNEMPLOYMENT AMONG WOMEN WITH CHILDREN AGES 6 TO 17 YEARS
0.2/ 100
METRIC RATING
269th/ 347
METRIC RANK
8.8%
UNEMPLOYMENT AMONG WOMEN WITH CHILDREN AGES 6 TO 17 YEARS
85.6/ 100
METRIC RATING
145th/ 347
METRIC RANK
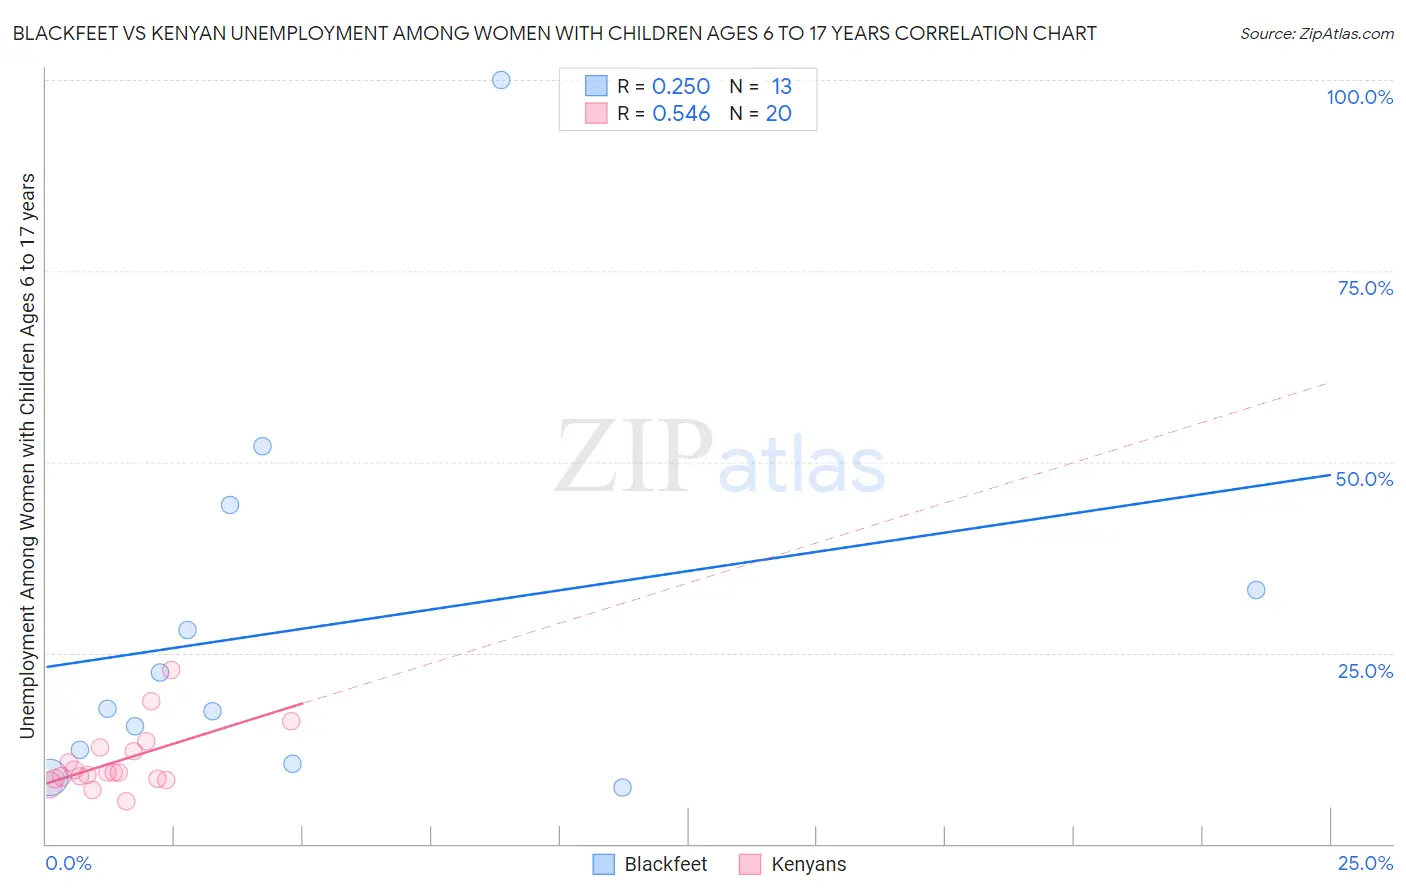
Blackfeet vs Kenyan Unemployment Among Women with Children Ages 6 to 17 years Correlation Chart
The statistical analysis conducted on geographies consisting of 237,122,541 people shows a weak positive correlation between the proportion of Blackfeet and unemployment rate among women with children between the ages 6 and 17 in the United States with a correlation coefficient (R) of 0.250 and weighted average of 9.6%. Similarly, the statistical analysis conducted on geographies consisting of 141,527,073 people shows a substantial positive correlation between the proportion of Kenyans and unemployment rate among women with children between the ages 6 and 17 in the United States with a correlation coefficient (R) of 0.546 and weighted average of 8.8%, a difference of 9.1%.
Unemployment Among Women with Children Ages 6 to 17 years Correlation Summary
| Measurement | Blackfeet | Kenyan |
| Minimum | 7.4% | 5.6% |
| Maximum | 100.0% | 22.7% |
| Range | 92.6% | 17.1% |
| Mean | 28.4% | 10.8% |
| Median | 17.6% | 9.3% |
| Interquartile 25% (IQ1) | 11.4% | 8.5% |
| Interquartile 75% (IQ3) | 38.8% | 12.3% |
| Interquartile Range (IQR) | 27.5% | 3.9% |
| Standard Deviation (Sample) | 25.5% | 4.2% |
| Standard Deviation (Population) | 24.5% | 4.1% |
Similar Demographics by Unemployment Among Women with Children Ages 6 to 17 years
Demographics Similar to Blackfeet by Unemployment Among Women with Children Ages 6 to 17 years
In terms of unemployment among women with children ages 6 to 17 years, the demographic groups most similar to Blackfeet are Ghanaian (9.6%, a difference of 0.080%), Immigrants from Nicaragua (9.6%, a difference of 0.10%), Irish (9.5%, a difference of 0.47%), Immigrants from Jamaica (9.5%, a difference of 0.49%), and Immigrants from Latin America (9.6%, a difference of 0.50%).
| Demographics | Rating | Rank | Unemployment Among Women with Children Ages 6 to 17 years |
| Senegalese | 0.5 /100 | #262 | Tragic 9.5% |
| Lebanese | 0.5 /100 | #263 | Tragic 9.5% |
| Immigrants | Ghana | 0.4 /100 | #264 | Tragic 9.5% |
| West Indians | 0.4 /100 | #265 | Tragic 9.5% |
| Immigrants | Jamaica | 0.3 /100 | #266 | Tragic 9.5% |
| Irish | 0.3 /100 | #267 | Tragic 9.5% |
| Ghanaians | 0.2 /100 | #268 | Tragic 9.6% |
| Blackfeet | 0.2 /100 | #269 | Tragic 9.6% |
| Immigrants | Nicaragua | 0.2 /100 | #270 | Tragic 9.6% |
| Immigrants | Latin America | 0.1 /100 | #271 | Tragic 9.6% |
| Kiowa | 0.1 /100 | #272 | Tragic 9.6% |
| Whites/Caucasians | 0.1 /100 | #273 | Tragic 9.6% |
| Aleuts | 0.1 /100 | #274 | Tragic 9.6% |
| U.S. Virgin Islanders | 0.1 /100 | #275 | Tragic 9.7% |
| Immigrants | Portugal | 0.1 /100 | #276 | Tragic 9.7% |
Demographics Similar to Kenyans by Unemployment Among Women with Children Ages 6 to 17 years
In terms of unemployment among women with children ages 6 to 17 years, the demographic groups most similar to Kenyans are Russian (8.8%, a difference of 0.020%), Immigrants from Kenya (8.8%, a difference of 0.050%), Immigrants from Austria (8.8%, a difference of 0.18%), Serbian (8.8%, a difference of 0.20%), and Immigrants from Poland (8.8%, a difference of 0.26%).
| Demographics | Rating | Rank | Unemployment Among Women with Children Ages 6 to 17 years |
| Immigrants | Ethiopia | 89.5 /100 | #138 | Excellent 8.8% |
| Northern Europeans | 89.2 /100 | #139 | Excellent 8.8% |
| Immigrants | Poland | 88.3 /100 | #140 | Excellent 8.8% |
| Serbians | 87.6 /100 | #141 | Excellent 8.8% |
| Immigrants | Austria | 87.5 /100 | #142 | Excellent 8.8% |
| Immigrants | Kenya | 86.1 /100 | #143 | Excellent 8.8% |
| Russians | 85.8 /100 | #144 | Excellent 8.8% |
| Kenyans | 85.6 /100 | #145 | Excellent 8.8% |
| Chileans | 80.8 /100 | #146 | Excellent 8.8% |
| Immigrants | Bangladesh | 79.4 /100 | #147 | Good 8.8% |
| Costa Ricans | 77.0 /100 | #148 | Good 8.8% |
| Croatians | 76.0 /100 | #149 | Good 8.8% |
| Greeks | 75.2 /100 | #150 | Good 8.9% |
| Immigrants | Eastern Africa | 74.6 /100 | #151 | Good 8.9% |
| Immigrants | Northern Europe | 74.6 /100 | #152 | Good 8.9% |