Ecuadorian vs Immigrants from Sierra Leone Unemployment
COMPARE
Ecuadorian
Immigrants from Sierra Leone
Unemployment
Unemployment Comparison
Ecuadorians
Immigrants from Sierra Leone
6.2%
UNEMPLOYMENT
0.0/ 100
METRIC RATING
288th/ 347
METRIC RANK
5.8%
UNEMPLOYMENT
0.1/ 100
METRIC RATING
268th/ 347
METRIC RANK
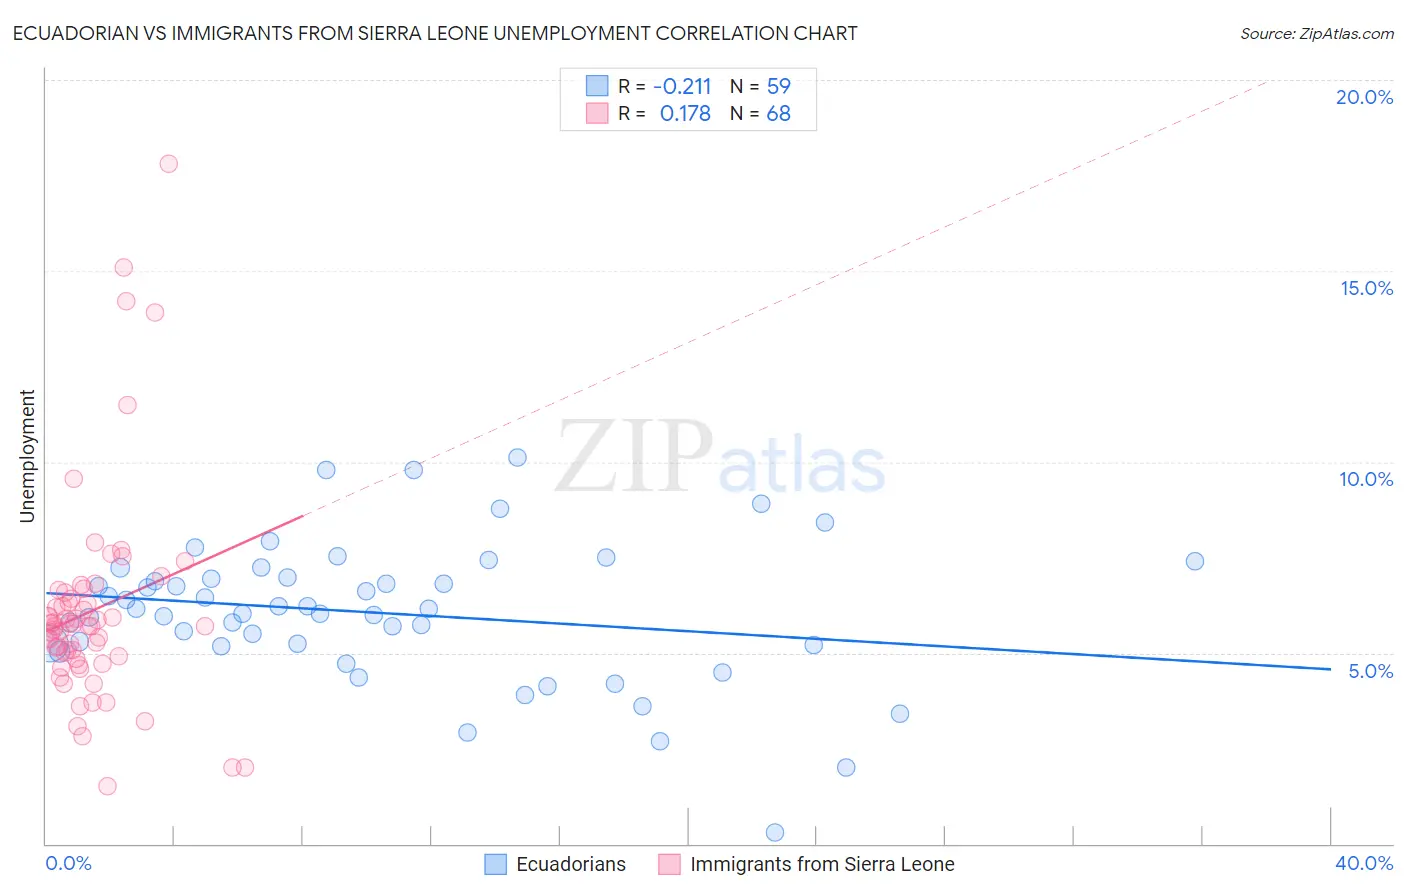
Ecuadorian vs Immigrants from Sierra Leone Unemployment Correlation Chart
The statistical analysis conducted on geographies consisting of 317,664,443 people shows a weak negative correlation between the proportion of Ecuadorians and unemployment in the United States with a correlation coefficient (R) of -0.211 and weighted average of 6.2%. Similarly, the statistical analysis conducted on geographies consisting of 101,634,526 people shows a poor positive correlation between the proportion of Immigrants from Sierra Leone and unemployment in the United States with a correlation coefficient (R) of 0.178 and weighted average of 5.8%, a difference of 5.7%.
Unemployment Correlation Summary
| Measurement | Ecuadorian | Immigrants from Sierra Leone |
| Minimum | 0.30% | 1.5% |
| Maximum | 10.1% | 17.8% |
| Range | 9.8% | 16.3% |
| Mean | 6.0% | 6.1% |
| Median | 6.2% | 5.7% |
| Interquartile 25% (IQ1) | 5.2% | 4.9% |
| Interquartile 75% (IQ3) | 7.0% | 6.5% |
| Interquartile Range (IQR) | 1.8% | 1.6% |
| Standard Deviation (Sample) | 1.8% | 2.8% |
| Standard Deviation (Population) | 1.8% | 2.8% |
Demographics Similar to Ecuadorians and Immigrants from Sierra Leone by Unemployment
In terms of unemployment, the demographic groups most similar to Ecuadorians are Nepalese (6.2%, a difference of 0.030%), Immigrants from Caribbean (6.2%, a difference of 0.36%), Immigrants from Senegal (6.1%, a difference of 0.79%), Aleut (6.1%, a difference of 1.7%), and Immigrants from Ghana (6.1%, a difference of 1.9%). Similarly, the demographic groups most similar to Immigrants from Sierra Leone are Immigrants from El Salvador (5.8%, a difference of 0.010%), Blackfeet (5.8%, a difference of 0.090%), Mexican (5.9%, a difference of 0.32%), Hispanic or Latino (5.9%, a difference of 1.0%), and Immigrants from Fiji (5.9%, a difference of 1.2%).
| Demographics | Rating | Rank | Unemployment |
| Immigrants | Sierra Leone | 0.1 /100 | #268 | Tragic 5.8% |
| Immigrants | El Salvador | 0.1 /100 | #269 | Tragic 5.8% |
| Blackfeet | 0.1 /100 | #270 | Tragic 5.8% |
| Mexicans | 0.1 /100 | #271 | Tragic 5.9% |
| Hispanics or Latinos | 0.0 /100 | #272 | Tragic 5.9% |
| Immigrants | Fiji | 0.0 /100 | #273 | Tragic 5.9% |
| Bahamians | 0.0 /100 | #274 | Tragic 5.9% |
| Immigrants | Latin America | 0.0 /100 | #275 | Tragic 5.9% |
| Immigrants | Central America | 0.0 /100 | #276 | Tragic 6.0% |
| Armenians | 0.0 /100 | #277 | Tragic 6.0% |
| Ghanaians | 0.0 /100 | #278 | Tragic 6.0% |
| Immigrants | Mexico | 0.0 /100 | #279 | Tragic 6.0% |
| Immigrants | Western Africa | 0.0 /100 | #280 | Tragic 6.0% |
| Africans | 0.0 /100 | #281 | Tragic 6.1% |
| Immigrants | Azores | 0.0 /100 | #282 | Tragic 6.1% |
| Immigrants | Ghana | 0.0 /100 | #283 | Tragic 6.1% |
| Aleuts | 0.0 /100 | #284 | Tragic 6.1% |
| Immigrants | Senegal | 0.0 /100 | #285 | Tragic 6.1% |
| Immigrants | Caribbean | 0.0 /100 | #286 | Tragic 6.2% |
| Nepalese | 0.0 /100 | #287 | Tragic 6.2% |
| Ecuadorians | 0.0 /100 | #288 | Tragic 6.2% |