Ecuadorian vs Immigrants from Australia Unemployment
COMPARE
Ecuadorian
Immigrants from Australia
Unemployment
Unemployment Comparison
Ecuadorians
Immigrants from Australia
6.2%
UNEMPLOYMENT
0.0/ 100
METRIC RATING
288th/ 347
METRIC RANK
5.0%
UNEMPLOYMENT
97.0/ 100
METRIC RATING
85th/ 347
METRIC RANK
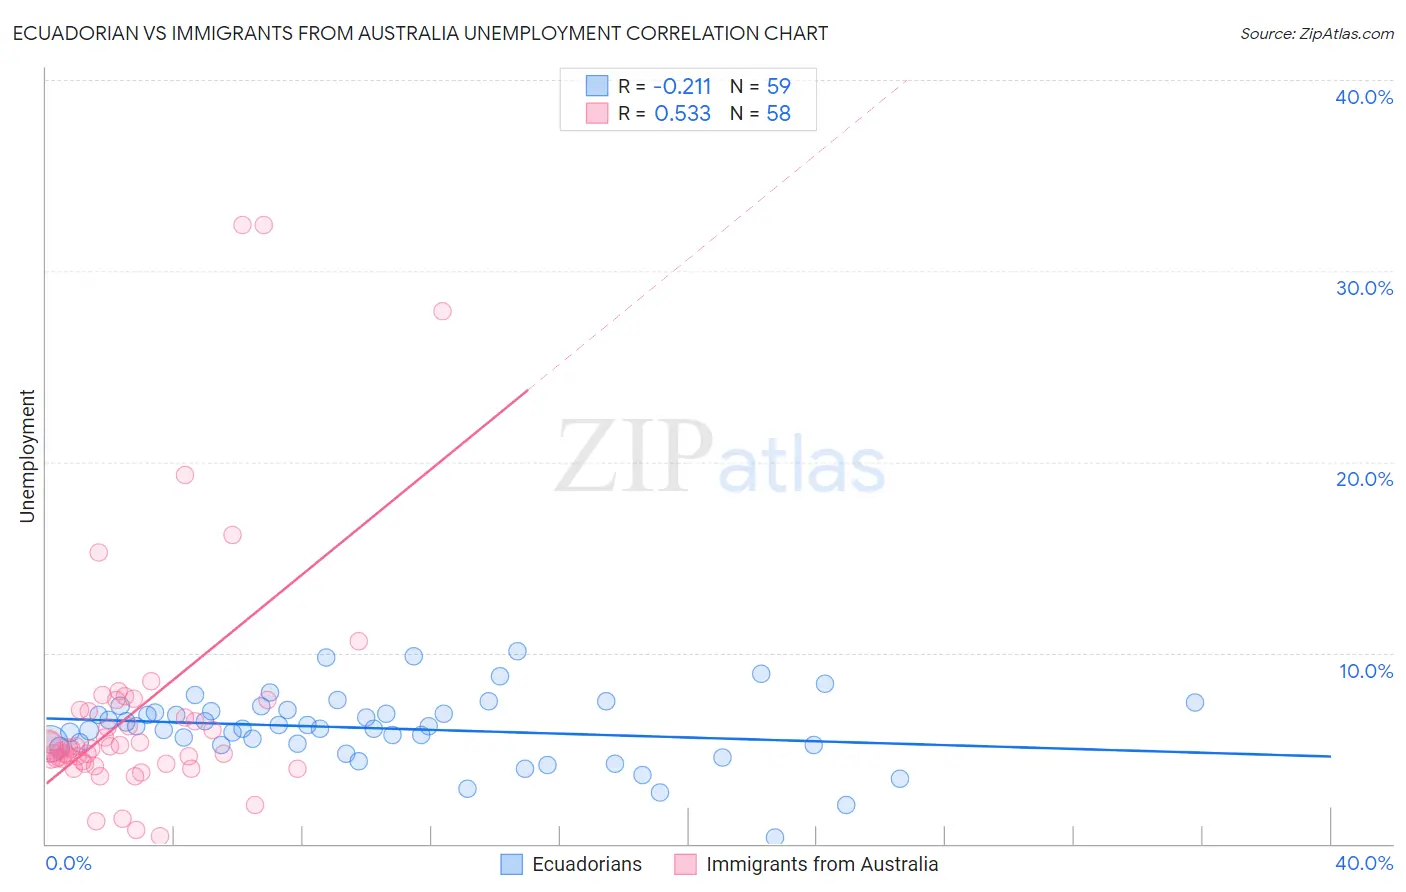
Ecuadorian vs Immigrants from Australia Unemployment Correlation Chart
The statistical analysis conducted on geographies consisting of 317,664,443 people shows a weak negative correlation between the proportion of Ecuadorians and unemployment in the United States with a correlation coefficient (R) of -0.211 and weighted average of 6.2%. Similarly, the statistical analysis conducted on geographies consisting of 227,110,462 people shows a substantial positive correlation between the proportion of Immigrants from Australia and unemployment in the United States with a correlation coefficient (R) of 0.533 and weighted average of 5.0%, a difference of 24.1%.
Unemployment Correlation Summary
| Measurement | Ecuadorian | Immigrants from Australia |
| Minimum | 0.30% | 0.40% |
| Maximum | 10.1% | 32.4% |
| Range | 9.8% | 32.0% |
| Mean | 6.0% | 7.0% |
| Median | 6.2% | 5.0% |
| Interquartile 25% (IQ1) | 5.2% | 4.3% |
| Interquartile 75% (IQ3) | 7.0% | 7.0% |
| Interquartile Range (IQR) | 1.8% | 2.7% |
| Standard Deviation (Sample) | 1.8% | 6.5% |
| Standard Deviation (Population) | 1.8% | 6.5% |
Similar Demographics by Unemployment
Demographics Similar to Ecuadorians by Unemployment
In terms of unemployment, the demographic groups most similar to Ecuadorians are Nepalese (6.2%, a difference of 0.030%), Chippewa (6.2%, a difference of 0.35%), Immigrants from Caribbean (6.2%, a difference of 0.36%), Senegalese (6.2%, a difference of 0.44%), and Immigrants from Senegal (6.1%, a difference of 0.79%).
| Demographics | Rating | Rank | Unemployment |
| Africans | 0.0 /100 | #281 | Tragic 6.1% |
| Immigrants | Azores | 0.0 /100 | #282 | Tragic 6.1% |
| Immigrants | Ghana | 0.0 /100 | #283 | Tragic 6.1% |
| Aleuts | 0.0 /100 | #284 | Tragic 6.1% |
| Immigrants | Senegal | 0.0 /100 | #285 | Tragic 6.1% |
| Immigrants | Caribbean | 0.0 /100 | #286 | Tragic 6.2% |
| Nepalese | 0.0 /100 | #287 | Tragic 6.2% |
| Ecuadorians | 0.0 /100 | #288 | Tragic 6.2% |
| Chippewa | 0.0 /100 | #289 | Tragic 6.2% |
| Senegalese | 0.0 /100 | #290 | Tragic 6.2% |
| Haitians | 0.0 /100 | #291 | Tragic 6.2% |
| Central American Indians | 0.0 /100 | #292 | Tragic 6.2% |
| Immigrants | Ecuador | 0.0 /100 | #293 | Tragic 6.2% |
| Spanish American Indians | 0.0 /100 | #294 | Tragic 6.2% |
| U.S. Virgin Islanders | 0.0 /100 | #295 | Tragic 6.3% |
Demographics Similar to Immigrants from Australia by Unemployment
In terms of unemployment, the demographic groups most similar to Immigrants from Australia are Hungarian (5.0%, a difference of 0.030%), Immigrants from Moldova (5.0%, a difference of 0.18%), Immigrants from Korea (5.0%, a difference of 0.21%), Russian (5.0%, a difference of 0.28%), and Jordanian (5.0%, a difference of 0.30%).
| Demographics | Rating | Rank | Unemployment |
| Okinawans | 97.9 /100 | #78 | Exceptional 4.9% |
| Canadians | 97.7 /100 | #79 | Exceptional 5.0% |
| Immigrants | Sweden | 97.6 /100 | #80 | Exceptional 5.0% |
| Basques | 97.6 /100 | #81 | Exceptional 5.0% |
| Fijians | 97.6 /100 | #82 | Exceptional 5.0% |
| Hmong | 97.6 /100 | #83 | Exceptional 5.0% |
| Russians | 97.4 /100 | #84 | Exceptional 5.0% |
| Immigrants | Australia | 97.0 /100 | #85 | Exceptional 5.0% |
| Hungarians | 96.9 /100 | #86 | Exceptional 5.0% |
| Immigrants | Moldova | 96.6 /100 | #87 | Exceptional 5.0% |
| Immigrants | Korea | 96.6 /100 | #88 | Exceptional 5.0% |
| Jordanians | 96.4 /100 | #89 | Exceptional 5.0% |
| Immigrants | North Macedonia | 96.3 /100 | #90 | Exceptional 5.0% |
| Immigrants | Sudan | 96.3 /100 | #91 | Exceptional 5.0% |
| Immigrants | South Africa | 96.2 /100 | #92 | Exceptional 5.0% |