Ecuadorian vs Finnish Unemployment
COMPARE
Ecuadorian
Finnish
Unemployment
Unemployment Comparison
Ecuadorians
Finns
6.2%
UNEMPLOYMENT
0.0/ 100
METRIC RATING
288th/ 347
METRIC RANK
4.7%
UNEMPLOYMENT
99.9/ 100
METRIC RATING
27th/ 347
METRIC RANK
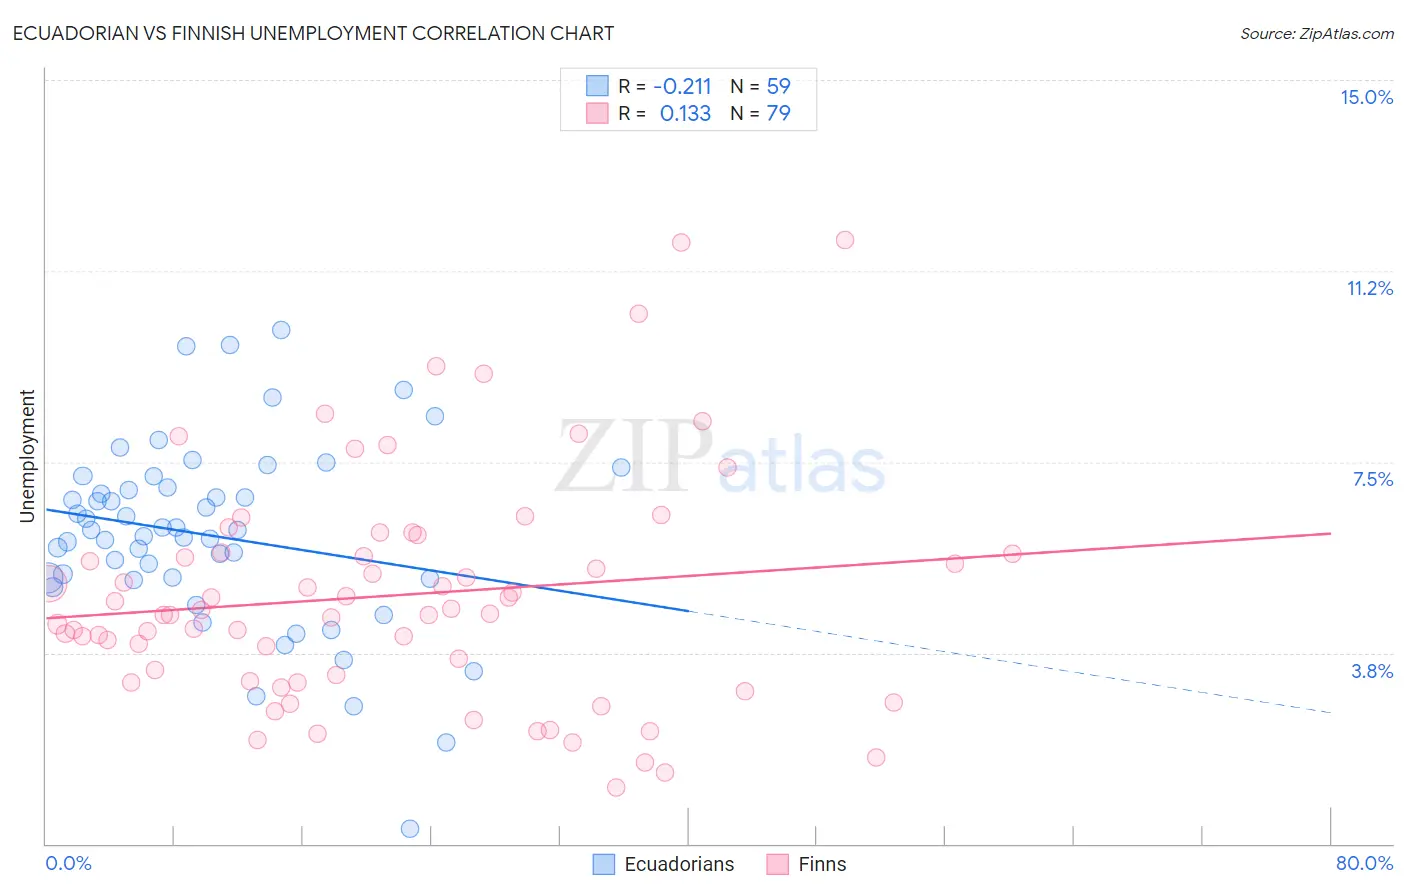
Ecuadorian vs Finnish Unemployment Correlation Chart
The statistical analysis conducted on geographies consisting of 317,664,443 people shows a weak negative correlation between the proportion of Ecuadorians and unemployment in the United States with a correlation coefficient (R) of -0.211 and weighted average of 6.2%. Similarly, the statistical analysis conducted on geographies consisting of 403,879,185 people shows a poor positive correlation between the proportion of Finns and unemployment in the United States with a correlation coefficient (R) of 0.133 and weighted average of 4.7%, a difference of 30.7%.
Unemployment Correlation Summary
| Measurement | Ecuadorian | Finnish |
| Minimum | 0.30% | 1.1% |
| Maximum | 10.1% | 11.9% |
| Range | 9.8% | 10.8% |
| Mean | 6.0% | 4.9% |
| Median | 6.2% | 4.5% |
| Interquartile 25% (IQ1) | 5.2% | 3.2% |
| Interquartile 75% (IQ3) | 7.0% | 5.7% |
| Interquartile Range (IQR) | 1.8% | 2.5% |
| Standard Deviation (Sample) | 1.8% | 2.3% |
| Standard Deviation (Population) | 1.8% | 2.2% |
Similar Demographics by Unemployment
Demographics Similar to Ecuadorians by Unemployment
In terms of unemployment, the demographic groups most similar to Ecuadorians are Nepalese (6.2%, a difference of 0.030%), Chippewa (6.2%, a difference of 0.35%), Immigrants from Caribbean (6.2%, a difference of 0.36%), Senegalese (6.2%, a difference of 0.44%), and Immigrants from Senegal (6.1%, a difference of 0.79%).
| Demographics | Rating | Rank | Unemployment |
| Africans | 0.0 /100 | #281 | Tragic 6.1% |
| Immigrants | Azores | 0.0 /100 | #282 | Tragic 6.1% |
| Immigrants | Ghana | 0.0 /100 | #283 | Tragic 6.1% |
| Aleuts | 0.0 /100 | #284 | Tragic 6.1% |
| Immigrants | Senegal | 0.0 /100 | #285 | Tragic 6.1% |
| Immigrants | Caribbean | 0.0 /100 | #286 | Tragic 6.2% |
| Nepalese | 0.0 /100 | #287 | Tragic 6.2% |
| Ecuadorians | 0.0 /100 | #288 | Tragic 6.2% |
| Chippewa | 0.0 /100 | #289 | Tragic 6.2% |
| Senegalese | 0.0 /100 | #290 | Tragic 6.2% |
| Haitians | 0.0 /100 | #291 | Tragic 6.2% |
| Central American Indians | 0.0 /100 | #292 | Tragic 6.2% |
| Immigrants | Ecuador | 0.0 /100 | #293 | Tragic 6.2% |
| Spanish American Indians | 0.0 /100 | #294 | Tragic 6.2% |
| U.S. Virgin Islanders | 0.0 /100 | #295 | Tragic 6.3% |
Demographics Similar to Finns by Unemployment
In terms of unemployment, the demographic groups most similar to Finns are Bulgarian (4.7%, a difference of 0.21%), Latvian (4.7%, a difference of 0.25%), Venezuelan (4.7%, a difference of 0.32%), Cuban (4.7%, a difference of 0.32%), and British (4.7%, a difference of 0.40%).
| Demographics | Rating | Rank | Unemployment |
| Carpatho Rusyns | 99.9 /100 | #20 | Exceptional 4.7% |
| Welsh | 99.9 /100 | #21 | Exceptional 4.7% |
| Thais | 99.9 /100 | #22 | Exceptional 4.7% |
| British | 99.9 /100 | #23 | Exceptional 4.7% |
| Venezuelans | 99.9 /100 | #24 | Exceptional 4.7% |
| Latvians | 99.9 /100 | #25 | Exceptional 4.7% |
| Bulgarians | 99.9 /100 | #26 | Exceptional 4.7% |
| Finns | 99.9 /100 | #27 | Exceptional 4.7% |
| Cubans | 99.8 /100 | #28 | Exceptional 4.7% |
| Poles | 99.8 /100 | #29 | Exceptional 4.7% |
| Irish | 99.8 /100 | #30 | Exceptional 4.8% |
| Croatians | 99.8 /100 | #31 | Exceptional 4.8% |
| Zimbabweans | 99.8 /100 | #32 | Exceptional 4.8% |
| Sudanese | 99.8 /100 | #33 | Exceptional 4.8% |
| Immigrants | Bolivia | 99.8 /100 | #34 | Exceptional 4.8% |