Lithuanian vs Immigrants from Sierra Leone Unemployment
COMPARE
Lithuanian
Immigrants from Sierra Leone
Unemployment
Unemployment Comparison
Lithuanians
Immigrants from Sierra Leone
4.8%
UNEMPLOYMENT
99.7/ 100
METRIC RATING
39th/ 347
METRIC RANK
5.8%
UNEMPLOYMENT
0.1/ 100
METRIC RATING
268th/ 347
METRIC RANK
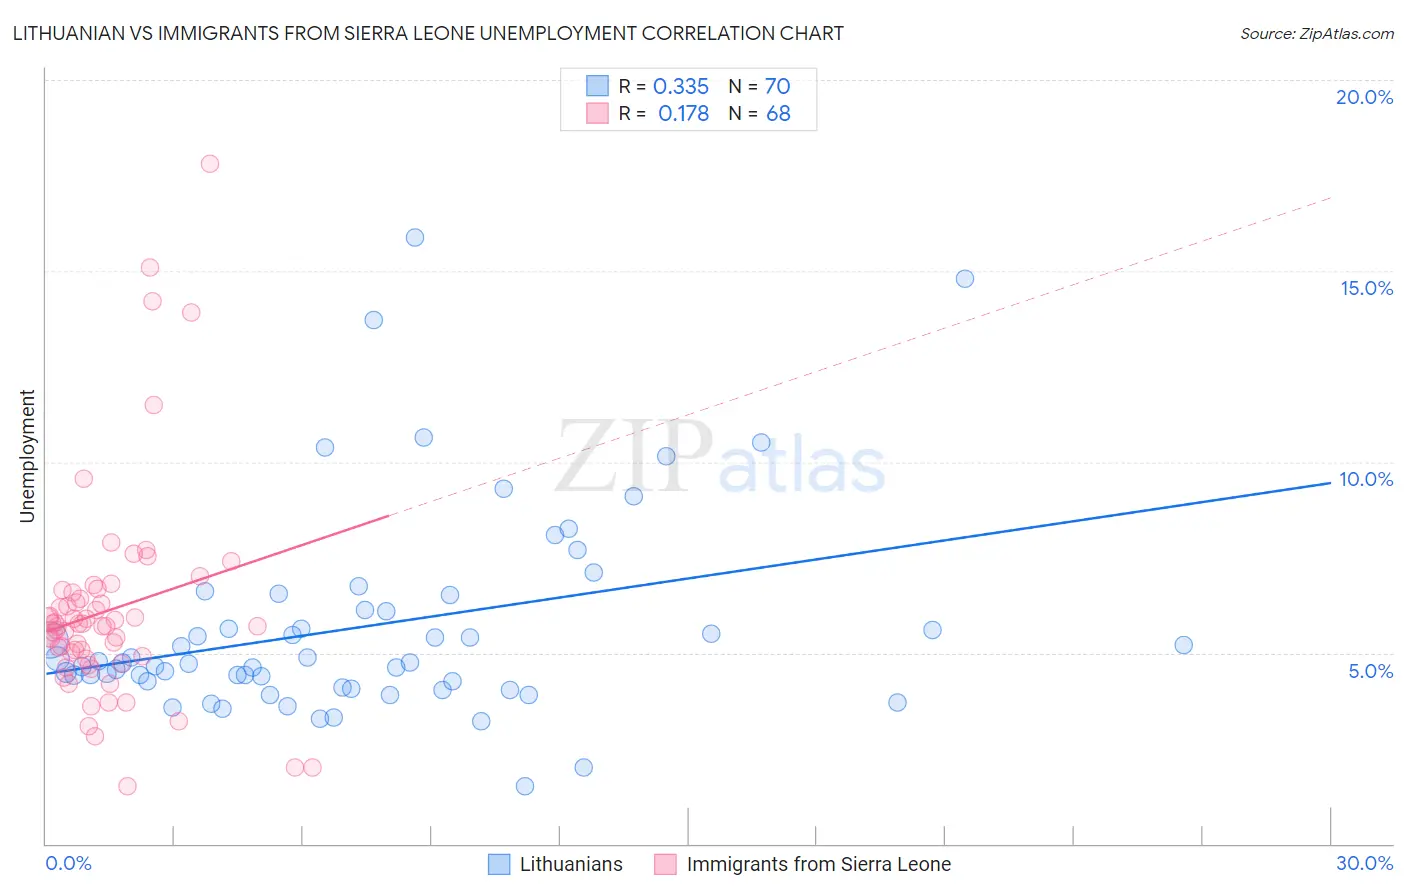
Lithuanian vs Immigrants from Sierra Leone Unemployment Correlation Chart
The statistical analysis conducted on geographies consisting of 421,273,270 people shows a mild positive correlation between the proportion of Lithuanians and unemployment in the United States with a correlation coefficient (R) of 0.335 and weighted average of 4.8%. Similarly, the statistical analysis conducted on geographies consisting of 101,634,526 people shows a poor positive correlation between the proportion of Immigrants from Sierra Leone and unemployment in the United States with a correlation coefficient (R) of 0.178 and weighted average of 5.8%, a difference of 21.7%.
Unemployment Correlation Summary
| Measurement | Lithuanian | Immigrants from Sierra Leone |
| Minimum | 1.5% | 1.5% |
| Maximum | 15.9% | 17.8% |
| Range | 14.4% | 16.3% |
| Mean | 5.7% | 6.1% |
| Median | 4.7% | 5.7% |
| Interquartile 25% (IQ1) | 4.3% | 4.9% |
| Interquartile 75% (IQ3) | 6.1% | 6.5% |
| Interquartile Range (IQR) | 1.9% | 1.6% |
| Standard Deviation (Sample) | 2.7% | 2.8% |
| Standard Deviation (Population) | 2.7% | 2.8% |
Similar Demographics by Unemployment
Demographics Similar to Lithuanians by Unemployment
In terms of unemployment, the demographic groups most similar to Lithuanians are Northern European (4.8%, a difference of 0.020%), Immigrants from Bosnia and Herzegovina (4.8%, a difference of 0.040%), Bolivian (4.8%, a difference of 0.14%), Czechoslovakian (4.8%, a difference of 0.34%), and Tongan (4.8%, a difference of 0.41%).
| Demographics | Rating | Rank | Unemployment |
| Zimbabweans | 99.8 /100 | #32 | Exceptional 4.8% |
| Sudanese | 99.8 /100 | #33 | Exceptional 4.8% |
| Immigrants | Bolivia | 99.8 /100 | #34 | Exceptional 4.8% |
| Scotch-Irish | 99.8 /100 | #35 | Exceptional 4.8% |
| Tongans | 99.7 /100 | #36 | Exceptional 4.8% |
| Czechoslovakians | 99.7 /100 | #37 | Exceptional 4.8% |
| Bolivians | 99.7 /100 | #38 | Exceptional 4.8% |
| Lithuanians | 99.7 /100 | #39 | Exceptional 4.8% |
| Northern Europeans | 99.7 /100 | #40 | Exceptional 4.8% |
| Immigrants | Bosnia and Herzegovina | 99.7 /100 | #41 | Exceptional 4.8% |
| Filipinos | 99.5 /100 | #42 | Exceptional 4.8% |
| Yugoslavians | 99.5 /100 | #43 | Exceptional 4.8% |
| Austrians | 99.5 /100 | #44 | Exceptional 4.8% |
| French | 99.5 /100 | #45 | Exceptional 4.8% |
| Immigrants | Nepal | 99.4 /100 | #46 | Exceptional 4.8% |
Demographics Similar to Immigrants from Sierra Leone by Unemployment
In terms of unemployment, the demographic groups most similar to Immigrants from Sierra Leone are Immigrants from El Salvador (5.8%, a difference of 0.010%), Immigrants from Nigeria (5.8%, a difference of 0.040%), Blackfeet (5.8%, a difference of 0.090%), Mexican American Indian (5.8%, a difference of 0.11%), and Mexican (5.9%, a difference of 0.32%).
| Demographics | Rating | Rank | Unemployment |
| Immigrants | Guatemala | 0.1 /100 | #261 | Tragic 5.8% |
| Sierra Leoneans | 0.1 /100 | #262 | Tragic 5.8% |
| Salvadorans | 0.1 /100 | #263 | Tragic 5.8% |
| Immigrants | Liberia | 0.1 /100 | #264 | Tragic 5.8% |
| Nigerians | 0.1 /100 | #265 | Tragic 5.8% |
| Mexican American Indians | 0.1 /100 | #266 | Tragic 5.8% |
| Immigrants | Nigeria | 0.1 /100 | #267 | Tragic 5.8% |
| Immigrants | Sierra Leone | 0.1 /100 | #268 | Tragic 5.8% |
| Immigrants | El Salvador | 0.1 /100 | #269 | Tragic 5.8% |
| Blackfeet | 0.1 /100 | #270 | Tragic 5.8% |
| Mexicans | 0.1 /100 | #271 | Tragic 5.9% |
| Hispanics or Latinos | 0.0 /100 | #272 | Tragic 5.9% |
| Immigrants | Fiji | 0.0 /100 | #273 | Tragic 5.9% |
| Bahamians | 0.0 /100 | #274 | Tragic 5.9% |
| Immigrants | Latin America | 0.0 /100 | #275 | Tragic 5.9% |