Ecuadorian vs Immigrants from Australia Unemployment Among Ages 25 to 29 years
COMPARE
Ecuadorian
Immigrants from Australia
Unemployment Among Ages 25 to 29 years
Unemployment Among Ages 25 to 29 years Comparison
Ecuadorians
Immigrants from Australia
7.4%
UNEMPLOYMENT AMONG AGES 25 TO 29 YEARS
0.1/ 100
METRIC RATING
262nd/ 347
METRIC RANK
6.2%
UNEMPLOYMENT AMONG AGES 25 TO 29 YEARS
99.0/ 100
METRIC RATING
48th/ 347
METRIC RANK
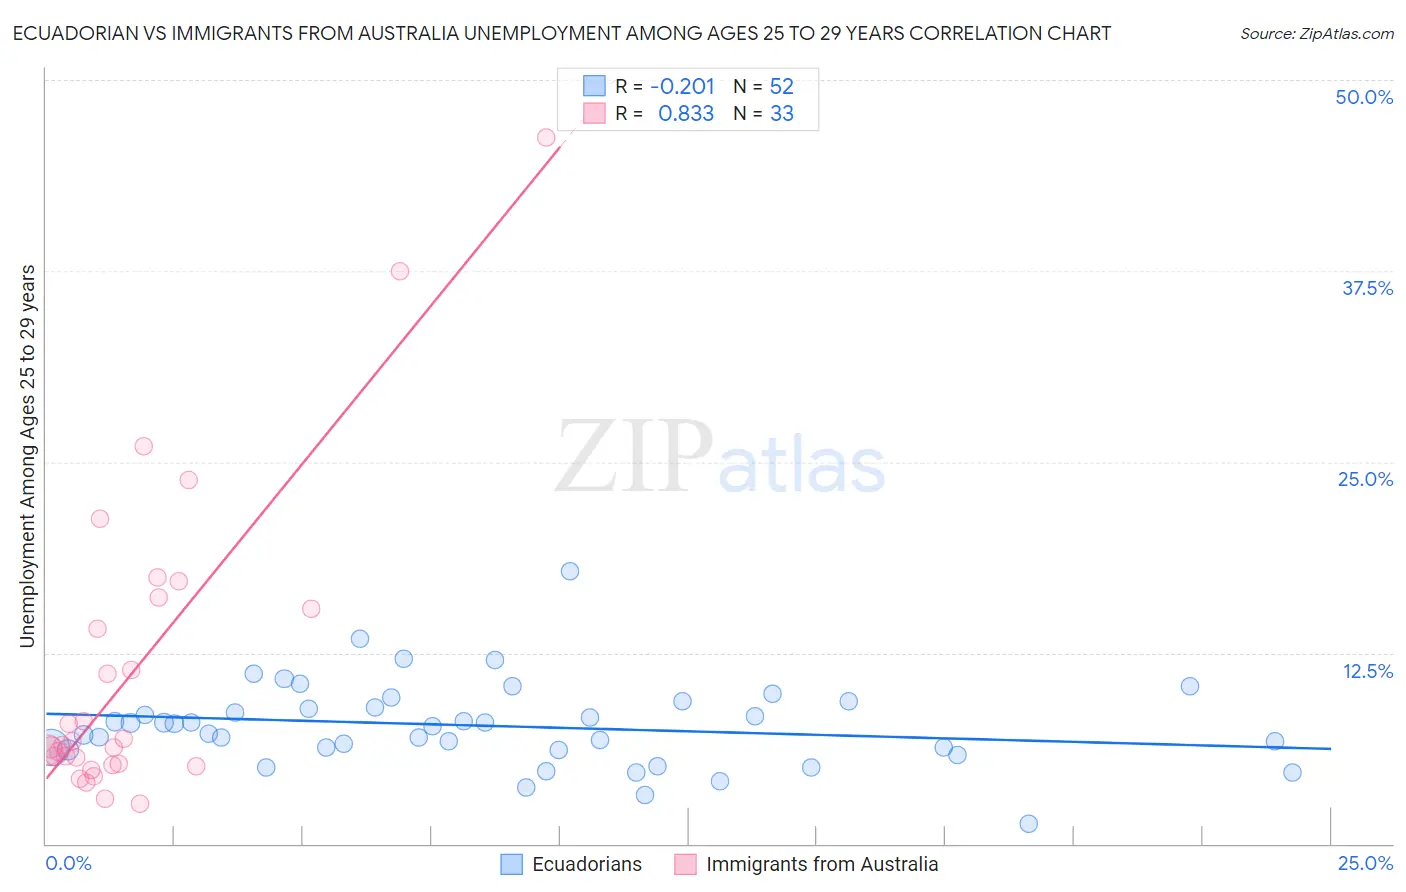
Ecuadorian vs Immigrants from Australia Unemployment Among Ages 25 to 29 years Correlation Chart
The statistical analysis conducted on geographies consisting of 307,503,017 people shows a weak negative correlation between the proportion of Ecuadorians and unemployment rate among population between the ages 25 and 29 in the United States with a correlation coefficient (R) of -0.201 and weighted average of 7.4%. Similarly, the statistical analysis conducted on geographies consisting of 219,503,985 people shows a very strong positive correlation between the proportion of Immigrants from Australia and unemployment rate among population between the ages 25 and 29 in the United States with a correlation coefficient (R) of 0.833 and weighted average of 6.2%, a difference of 19.5%.
Unemployment Among Ages 25 to 29 years Correlation Summary
| Measurement | Ecuadorian | Immigrants from Australia |
| Minimum | 1.3% | 2.6% |
| Maximum | 17.8% | 46.2% |
| Range | 16.5% | 43.6% |
| Mean | 7.7% | 11.3% |
| Median | 7.8% | 6.5% |
| Interquartile 25% (IQ1) | 6.2% | 5.2% |
| Interquartile 75% (IQ3) | 9.1% | 15.8% |
| Interquartile Range (IQR) | 2.9% | 10.5% |
| Standard Deviation (Sample) | 2.8% | 10.0% |
| Standard Deviation (Population) | 2.8% | 9.9% |
Similar Demographics by Unemployment Among Ages 25 to 29 years
Demographics Similar to Ecuadorians by Unemployment Among Ages 25 to 29 years
In terms of unemployment among ages 25 to 29 years, the demographic groups most similar to Ecuadorians are Nigerian (7.4%, a difference of 0.050%), Kiowa (7.4%, a difference of 0.080%), American (7.4%, a difference of 0.14%), Immigrants from Western Africa (7.4%, a difference of 0.17%), and Immigrants from Fiji (7.4%, a difference of 0.23%).
| Demographics | Rating | Rank | Unemployment Among Ages 25 to 29 years |
| Immigrants | Cameroon | 0.3 /100 | #255 | Tragic 7.2% |
| Mexican American Indians | 0.3 /100 | #256 | Tragic 7.3% |
| Assyrians/Chaldeans/Syriacs | 0.2 /100 | #257 | Tragic 7.3% |
| Ottawa | 0.1 /100 | #258 | Tragic 7.3% |
| Cree | 0.1 /100 | #259 | Tragic 7.3% |
| Americans | 0.1 /100 | #260 | Tragic 7.4% |
| Nigerians | 0.1 /100 | #261 | Tragic 7.4% |
| Ecuadorians | 0.1 /100 | #262 | Tragic 7.4% |
| Kiowa | 0.1 /100 | #263 | Tragic 7.4% |
| Immigrants | Western Africa | 0.1 /100 | #264 | Tragic 7.4% |
| Immigrants | Fiji | 0.1 /100 | #265 | Tragic 7.4% |
| Paiute | 0.1 /100 | #266 | Tragic 7.4% |
| Pennsylvania Germans | 0.1 /100 | #267 | Tragic 7.4% |
| Immigrants | Ecuador | 0.1 /100 | #268 | Tragic 7.4% |
| Immigrants | Latin America | 0.1 /100 | #269 | Tragic 7.4% |
Demographics Similar to Immigrants from Australia by Unemployment Among Ages 25 to 29 years
In terms of unemployment among ages 25 to 29 years, the demographic groups most similar to Immigrants from Australia are Latvian (6.2%, a difference of 0.010%), Immigrants from Lithuania (6.2%, a difference of 0.030%), German Russian (6.2%, a difference of 0.070%), Venezuelan (6.2%, a difference of 0.11%), and Soviet Union (6.2%, a difference of 0.12%).
| Demographics | Rating | Rank | Unemployment Among Ages 25 to 29 years |
| Fijians | 99.3 /100 | #41 | Exceptional 6.1% |
| Jordanians | 99.3 /100 | #42 | Exceptional 6.1% |
| Czechs | 99.2 /100 | #43 | Exceptional 6.2% |
| Mongolians | 99.2 /100 | #44 | Exceptional 6.2% |
| Venezuelans | 99.1 /100 | #45 | Exceptional 6.2% |
| Immigrants | Lithuania | 99.0 /100 | #46 | Exceptional 6.2% |
| Latvians | 99.0 /100 | #47 | Exceptional 6.2% |
| Immigrants | Australia | 99.0 /100 | #48 | Exceptional 6.2% |
| German Russians | 99.0 /100 | #49 | Exceptional 6.2% |
| Soviet Union | 98.9 /100 | #50 | Exceptional 6.2% |
| Burmese | 98.9 /100 | #51 | Exceptional 6.2% |
| Immigrants | Turkey | 98.9 /100 | #52 | Exceptional 6.2% |
| Turks | 98.8 /100 | #53 | Exceptional 6.2% |
| Swedes | 98.8 /100 | #54 | Exceptional 6.2% |
| Immigrants | Netherlands | 98.7 /100 | #55 | Exceptional 6.2% |