Dutch West Indian vs Immigrants from Northern Europe Unemployment Among Ages 45 to 54 years
COMPARE
Dutch West Indian
Immigrants from Northern Europe
Unemployment Among Ages 45 to 54 years
Unemployment Among Ages 45 to 54 years Comparison
Dutch West Indians
Immigrants from Northern Europe
5.0%
UNEMPLOYMENT AMONG AGES 45 TO 54 YEARS
0.0/ 100
METRIC RATING
278th/ 347
METRIC RANK
4.4%
UNEMPLOYMENT AMONG AGES 45 TO 54 YEARS
86.9/ 100
METRIC RATING
128th/ 347
METRIC RANK
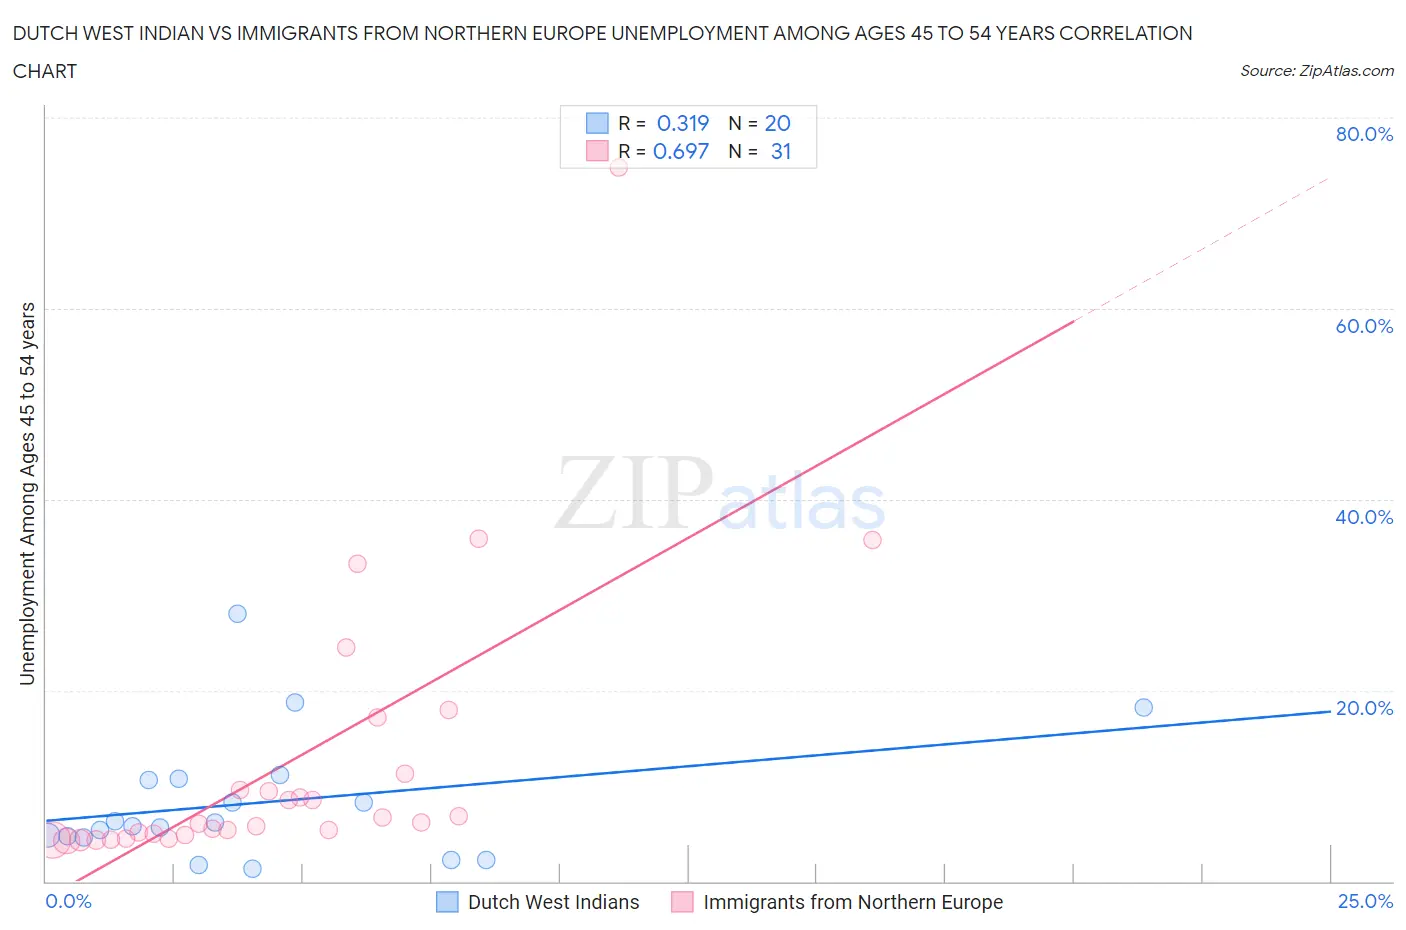
Dutch West Indian vs Immigrants from Northern Europe Unemployment Among Ages 45 to 54 years Correlation Chart
The statistical analysis conducted on geographies consisting of 84,454,411 people shows a mild positive correlation between the proportion of Dutch West Indians and unemployment rate among population between the ages 45 and 54 in the United States with a correlation coefficient (R) of 0.319 and weighted average of 5.0%. Similarly, the statistical analysis conducted on geographies consisting of 458,529,827 people shows a significant positive correlation between the proportion of Immigrants from Northern Europe and unemployment rate among population between the ages 45 and 54 in the United States with a correlation coefficient (R) of 0.697 and weighted average of 4.4%, a difference of 13.9%.
Unemployment Among Ages 45 to 54 years Correlation Summary
| Measurement | Dutch West Indian | Immigrants from Northern Europe |
| Minimum | 1.3% | 4.2% |
| Maximum | 28.0% | 74.7% |
| Range | 26.7% | 70.5% |
| Mean | 8.2% | 12.5% |
| Median | 5.9% | 6.1% |
| Interquartile 25% (IQ1) | 4.7% | 4.9% |
| Interquartile 75% (IQ3) | 10.7% | 11.2% |
| Interquartile Range (IQR) | 6.0% | 6.3% |
| Standard Deviation (Sample) | 6.7% | 14.9% |
| Standard Deviation (Population) | 6.5% | 14.6% |
Similar Demographics by Unemployment Among Ages 45 to 54 years
Demographics Similar to Dutch West Indians by Unemployment Among Ages 45 to 54 years
In terms of unemployment among ages 45 to 54 years, the demographic groups most similar to Dutch West Indians are Nepalese (5.0%, a difference of 0.14%), Immigrants from Mexico (5.0%, a difference of 0.21%), French American Indian (5.0%, a difference of 0.33%), Blackfeet (5.1%, a difference of 0.35%), and Spanish American Indian (5.1%, a difference of 0.42%).
| Demographics | Rating | Rank | Unemployment Among Ages 45 to 54 years |
| Cajuns | 0.0 /100 | #271 | Tragic 5.0% |
| Immigrants | Central America | 0.0 /100 | #272 | Tragic 5.0% |
| Immigrants | Latin America | 0.0 /100 | #273 | Tragic 5.0% |
| U.S. Virgin Islanders | 0.0 /100 | #274 | Tragic 5.0% |
| Bermudans | 0.0 /100 | #275 | Tragic 5.0% |
| French American Indians | 0.0 /100 | #276 | Tragic 5.0% |
| Immigrants | Mexico | 0.0 /100 | #277 | Tragic 5.0% |
| Dutch West Indians | 0.0 /100 | #278 | Tragic 5.0% |
| Nepalese | 0.0 /100 | #279 | Tragic 5.0% |
| Blackfeet | 0.0 /100 | #280 | Tragic 5.1% |
| Spanish American Indians | 0.0 /100 | #281 | Tragic 5.1% |
| Africans | 0.0 /100 | #282 | Tragic 5.1% |
| Hispanics or Latinos | 0.0 /100 | #283 | Tragic 5.1% |
| Kiowa | 0.0 /100 | #284 | Tragic 5.1% |
| Iroquois | 0.0 /100 | #285 | Tragic 5.1% |
Demographics Similar to Immigrants from Northern Europe by Unemployment Among Ages 45 to 54 years
In terms of unemployment among ages 45 to 54 years, the demographic groups most similar to Immigrants from Northern Europe are Laotian (4.4%, a difference of 0.060%), Nicaraguan (4.4%, a difference of 0.080%), Celtic (4.4%, a difference of 0.080%), Immigrants from Czechoslovakia (4.4%, a difference of 0.090%), and Immigrants from Germany (4.4%, a difference of 0.10%).
| Demographics | Rating | Rank | Unemployment Among Ages 45 to 54 years |
| Immigrants | Oceania | 89.5 /100 | #121 | Excellent 4.4% |
| Immigrants | Kazakhstan | 89.5 /100 | #122 | Excellent 4.4% |
| Immigrants | Asia | 88.8 /100 | #123 | Excellent 4.4% |
| Spanish | 88.8 /100 | #124 | Excellent 4.4% |
| Immigrants | Vietnam | 88.6 /100 | #125 | Excellent 4.4% |
| Immigrants | Czechoslovakia | 87.8 /100 | #126 | Excellent 4.4% |
| Nicaraguans | 87.6 /100 | #127 | Excellent 4.4% |
| Immigrants | Northern Europe | 86.9 /100 | #128 | Excellent 4.4% |
| Laotians | 86.3 /100 | #129 | Excellent 4.4% |
| Celtics | 86.2 /100 | #130 | Excellent 4.4% |
| Immigrants | Germany | 85.9 /100 | #131 | Excellent 4.4% |
| Immigrants | Eastern Africa | 85.1 /100 | #132 | Excellent 4.4% |
| Immigrants | Cameroon | 84.8 /100 | #133 | Excellent 4.4% |
| Afghans | 84.6 /100 | #134 | Excellent 4.4% |
| Immigrants | Eastern Asia | 84.0 /100 | #135 | Excellent 4.4% |