Dutch West Indian vs Immigrants from Northern Europe Unemployment Among Women with Children Ages 6 to 17 years
COMPARE
Dutch West Indian
Immigrants from Northern Europe
Unemployment Among Women with Children Ages 6 to 17 years
Unemployment Among Women with Children Ages 6 to 17 years Comparison
Dutch West Indians
Immigrants from Northern Europe
10.2%
UNEMPLOYMENT AMONG WOMEN WITH CHILDREN AGES 6 TO 17 YEARS
0.0/ 100
METRIC RATING
308th/ 347
METRIC RANK
8.9%
UNEMPLOYMENT AMONG WOMEN WITH CHILDREN AGES 6 TO 17 YEARS
74.6/ 100
METRIC RATING
152nd/ 347
METRIC RANK
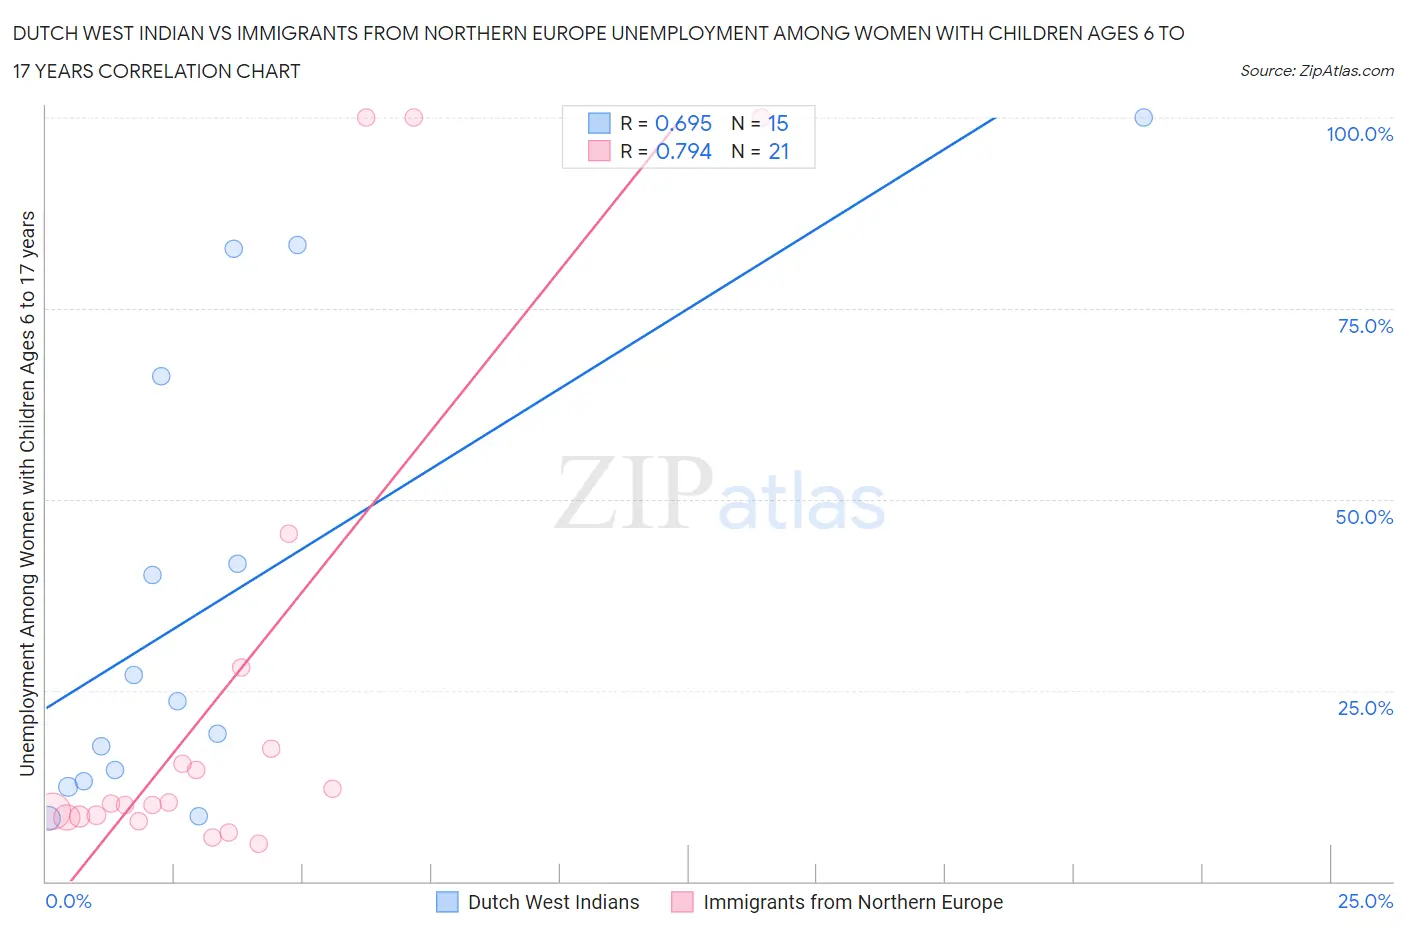
Dutch West Indian vs Immigrants from Northern Europe Unemployment Among Women with Children Ages 6 to 17 years Correlation Chart
The statistical analysis conducted on geographies consisting of 73,777,912 people shows a significant positive correlation between the proportion of Dutch West Indians and unemployment rate among women with children between the ages 6 and 17 in the United States with a correlation coefficient (R) of 0.695 and weighted average of 10.2%. Similarly, the statistical analysis conducted on geographies consisting of 322,644,598 people shows a strong positive correlation between the proportion of Immigrants from Northern Europe and unemployment rate among women with children between the ages 6 and 17 in the United States with a correlation coefficient (R) of 0.794 and weighted average of 8.9%, a difference of 15.7%.
Unemployment Among Women with Children Ages 6 to 17 years Correlation Summary
| Measurement | Dutch West Indian | Immigrants from Northern Europe |
| Minimum | 8.2% | 4.9% |
| Maximum | 100.0% | 100.0% |
| Range | 91.8% | 95.1% |
| Mean | 37.2% | 25.4% |
| Median | 23.6% | 10.1% |
| Interquartile 25% (IQ1) | 13.0% | 8.4% |
| Interquartile 75% (IQ3) | 66.1% | 22.7% |
| Interquartile Range (IQR) | 53.1% | 14.3% |
| Standard Deviation (Sample) | 30.9% | 32.5% |
| Standard Deviation (Population) | 29.9% | 31.7% |
Similar Demographics by Unemployment Among Women with Children Ages 6 to 17 years
Demographics Similar to Dutch West Indians by Unemployment Among Women with Children Ages 6 to 17 years
In terms of unemployment among women with children ages 6 to 17 years, the demographic groups most similar to Dutch West Indians are Immigrants from Senegal (10.2%, a difference of 0.010%), Paraguayan (10.2%, a difference of 0.24%), Immigrants from Nigeria (10.2%, a difference of 0.53%), French Canadian (10.3%, a difference of 0.54%), and Immigrants from Venezuela (10.2%, a difference of 0.59%).
| Demographics | Rating | Rank | Unemployment Among Women with Children Ages 6 to 17 years |
| Immigrants | Bahamas | 0.0 /100 | #301 | Tragic 10.1% |
| Venezuelans | 0.0 /100 | #302 | Tragic 10.2% |
| Immigrants | Ecuador | 0.0 /100 | #303 | Tragic 10.2% |
| Immigrants | Venezuela | 0.0 /100 | #304 | Tragic 10.2% |
| Immigrants | Nigeria | 0.0 /100 | #305 | Tragic 10.2% |
| Paraguayans | 0.0 /100 | #306 | Tragic 10.2% |
| Immigrants | Senegal | 0.0 /100 | #307 | Tragic 10.2% |
| Dutch West Indians | 0.0 /100 | #308 | Tragic 10.2% |
| French Canadians | 0.0 /100 | #309 | Tragic 10.3% |
| Alaska Natives | 0.0 /100 | #310 | Tragic 10.3% |
| Immigrants | Liberia | 0.0 /100 | #311 | Tragic 10.3% |
| Africans | 0.0 /100 | #312 | Tragic 10.4% |
| Americans | 0.0 /100 | #313 | Tragic 10.4% |
| Immigrants | Cabo Verde | 0.0 /100 | #314 | Tragic 10.4% |
| Bahamians | 0.0 /100 | #315 | Tragic 10.4% |
Demographics Similar to Immigrants from Northern Europe by Unemployment Among Women with Children Ages 6 to 17 years
In terms of unemployment among women with children ages 6 to 17 years, the demographic groups most similar to Immigrants from Northern Europe are Immigrants from Eastern Africa (8.9%, a difference of 0.0%), Greek (8.9%, a difference of 0.040%), Immigrants from Europe (8.9%, a difference of 0.070%), Croatian (8.8%, a difference of 0.090%), and Vietnamese (8.9%, a difference of 0.14%).
| Demographics | Rating | Rank | Unemployment Among Women with Children Ages 6 to 17 years |
| Kenyans | 85.6 /100 | #145 | Excellent 8.8% |
| Chileans | 80.8 /100 | #146 | Excellent 8.8% |
| Immigrants | Bangladesh | 79.4 /100 | #147 | Good 8.8% |
| Costa Ricans | 77.0 /100 | #148 | Good 8.8% |
| Croatians | 76.0 /100 | #149 | Good 8.8% |
| Greeks | 75.2 /100 | #150 | Good 8.9% |
| Immigrants | Eastern Africa | 74.6 /100 | #151 | Good 8.9% |
| Immigrants | Northern Europe | 74.6 /100 | #152 | Good 8.9% |
| Immigrants | Europe | 73.4 /100 | #153 | Good 8.9% |
| Vietnamese | 72.1 /100 | #154 | Good 8.9% |
| Immigrants | Greece | 71.8 /100 | #155 | Good 8.9% |
| Osage | 65.9 /100 | #156 | Good 8.9% |
| Immigrants | Belgium | 65.6 /100 | #157 | Good 8.9% |
| Immigrants | Chile | 65.3 /100 | #158 | Good 8.9% |
| Spanish | 63.8 /100 | #159 | Good 8.9% |