Dutch West Indian vs Immigrants from Uruguay Unemployment Among Women with Children Ages 6 to 17 years
COMPARE
Dutch West Indian
Immigrants from Uruguay
Unemployment Among Women with Children Ages 6 to 17 years
Unemployment Among Women with Children Ages 6 to 17 years Comparison
Dutch West Indians
Immigrants from Uruguay
10.2%
UNEMPLOYMENT AMONG WOMEN WITH CHILDREN AGES 6 TO 17 YEARS
0.0/ 100
METRIC RATING
308th/ 347
METRIC RANK
9.2%
UNEMPLOYMENT AMONG WOMEN WITH CHILDREN AGES 6 TO 17 YEARS
7.2/ 100
METRIC RATING
216th/ 347
METRIC RANK
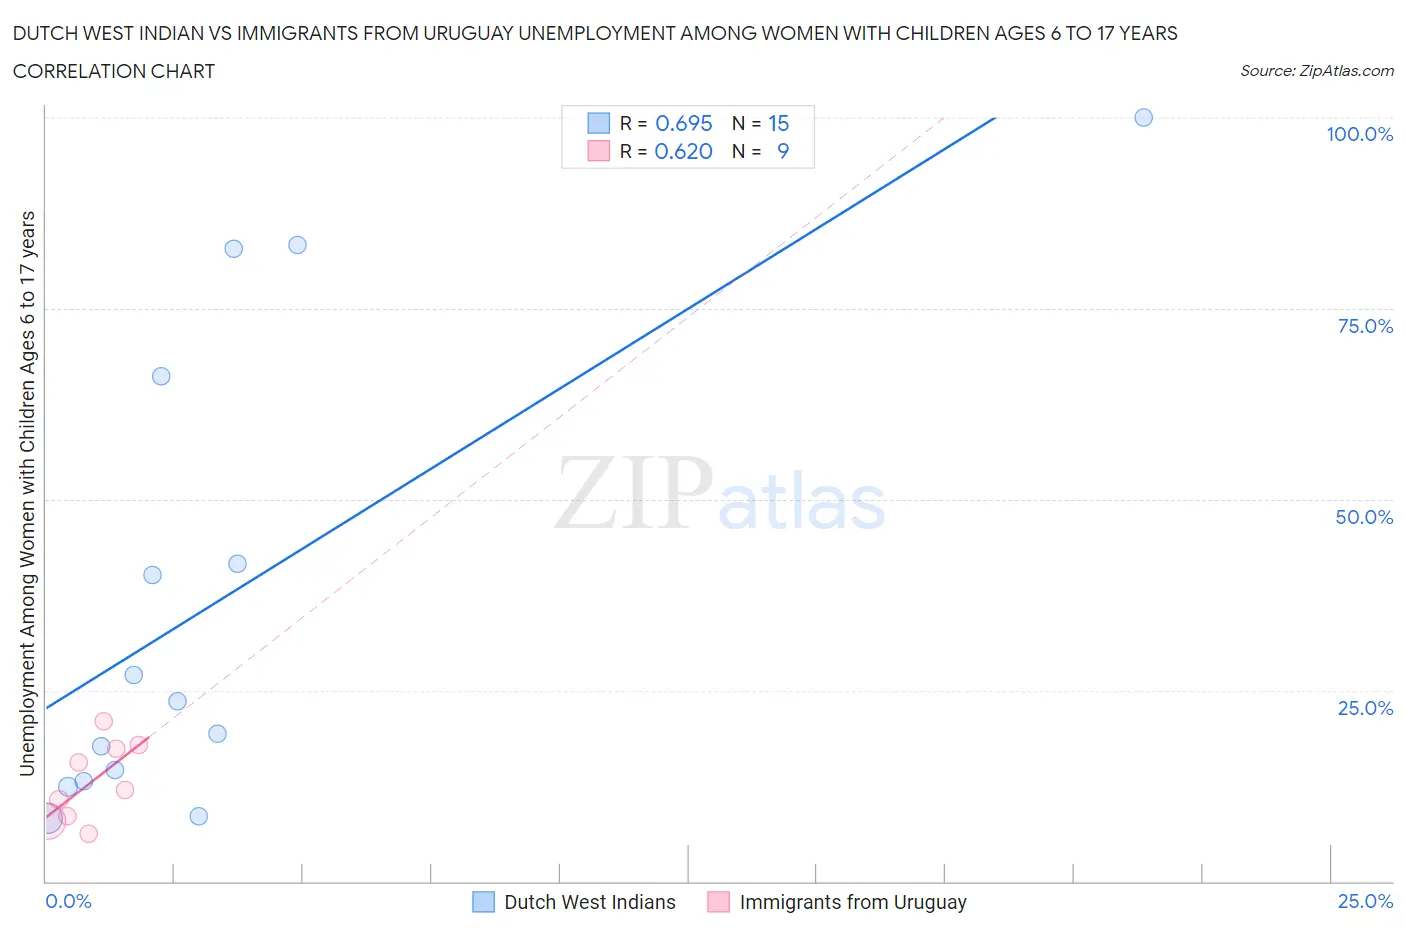
Dutch West Indian vs Immigrants from Uruguay Unemployment Among Women with Children Ages 6 to 17 years Correlation Chart
The statistical analysis conducted on geographies consisting of 73,777,912 people shows a significant positive correlation between the proportion of Dutch West Indians and unemployment rate among women with children between the ages 6 and 17 in the United States with a correlation coefficient (R) of 0.695 and weighted average of 10.2%. Similarly, the statistical analysis conducted on geographies consisting of 113,048,827 people shows a significant positive correlation between the proportion of Immigrants from Uruguay and unemployment rate among women with children between the ages 6 and 17 in the United States with a correlation coefficient (R) of 0.620 and weighted average of 9.2%, a difference of 11.2%.
Unemployment Among Women with Children Ages 6 to 17 years Correlation Summary
| Measurement | Dutch West Indian | Immigrants from Uruguay |
| Minimum | 8.2% | 6.2% |
| Maximum | 100.0% | 21.0% |
| Range | 91.8% | 14.8% |
| Mean | 37.2% | 13.0% |
| Median | 23.6% | 12.0% |
| Interquartile 25% (IQ1) | 13.0% | 8.2% |
| Interquartile 75% (IQ3) | 66.1% | 17.6% |
| Interquartile Range (IQR) | 53.1% | 9.4% |
| Standard Deviation (Sample) | 30.9% | 5.1% |
| Standard Deviation (Population) | 29.9% | 4.9% |
Similar Demographics by Unemployment Among Women with Children Ages 6 to 17 years
Demographics Similar to Dutch West Indians by Unemployment Among Women with Children Ages 6 to 17 years
In terms of unemployment among women with children ages 6 to 17 years, the demographic groups most similar to Dutch West Indians are Immigrants from Senegal (10.2%, a difference of 0.010%), Paraguayan (10.2%, a difference of 0.24%), Immigrants from Nigeria (10.2%, a difference of 0.53%), French Canadian (10.3%, a difference of 0.54%), and Immigrants from Venezuela (10.2%, a difference of 0.59%).
| Demographics | Rating | Rank | Unemployment Among Women with Children Ages 6 to 17 years |
| Immigrants | Bahamas | 0.0 /100 | #301 | Tragic 10.1% |
| Venezuelans | 0.0 /100 | #302 | Tragic 10.2% |
| Immigrants | Ecuador | 0.0 /100 | #303 | Tragic 10.2% |
| Immigrants | Venezuela | 0.0 /100 | #304 | Tragic 10.2% |
| Immigrants | Nigeria | 0.0 /100 | #305 | Tragic 10.2% |
| Paraguayans | 0.0 /100 | #306 | Tragic 10.2% |
| Immigrants | Senegal | 0.0 /100 | #307 | Tragic 10.2% |
| Dutch West Indians | 0.0 /100 | #308 | Tragic 10.2% |
| French Canadians | 0.0 /100 | #309 | Tragic 10.3% |
| Alaska Natives | 0.0 /100 | #310 | Tragic 10.3% |
| Immigrants | Liberia | 0.0 /100 | #311 | Tragic 10.3% |
| Africans | 0.0 /100 | #312 | Tragic 10.4% |
| Americans | 0.0 /100 | #313 | Tragic 10.4% |
| Immigrants | Cabo Verde | 0.0 /100 | #314 | Tragic 10.4% |
| Bahamians | 0.0 /100 | #315 | Tragic 10.4% |
Demographics Similar to Immigrants from Uruguay by Unemployment Among Women with Children Ages 6 to 17 years
In terms of unemployment among women with children ages 6 to 17 years, the demographic groups most similar to Immigrants from Uruguay are Immigrants from Germany (9.2%, a difference of 0.0%), German (9.2%, a difference of 0.010%), Iroquois (9.2%, a difference of 0.040%), Syrian (9.2%, a difference of 0.060%), and Immigrants from Scotland (9.2%, a difference of 0.11%).
| Demographics | Rating | Rank | Unemployment Among Women with Children Ages 6 to 17 years |
| Salvadorans | 10.7 /100 | #209 | Poor 9.2% |
| Finns | 10.0 /100 | #210 | Tragic 9.2% |
| Immigrants | Cuba | 9.6 /100 | #211 | Tragic 9.2% |
| Peruvians | 9.0 /100 | #212 | Tragic 9.2% |
| Spaniards | 8.2 /100 | #213 | Tragic 9.2% |
| Iroquois | 7.5 /100 | #214 | Tragic 9.2% |
| Immigrants | Germany | 7.2 /100 | #215 | Tragic 9.2% |
| Immigrants | Uruguay | 7.2 /100 | #216 | Tragic 9.2% |
| Germans | 7.2 /100 | #217 | Tragic 9.2% |
| Syrians | 6.9 /100 | #218 | Tragic 9.2% |
| Immigrants | Scotland | 6.6 /100 | #219 | Tragic 9.2% |
| Belgians | 6.4 /100 | #220 | Tragic 9.2% |
| Crow | 5.8 /100 | #221 | Tragic 9.2% |
| Immigrants | Southern Europe | 5.8 /100 | #222 | Tragic 9.2% |
| Immigrants | Eritrea | 5.8 /100 | #223 | Tragic 9.2% |