Croatian vs Peruvian Male Unemployment
COMPARE
Croatian
Peruvian
Male Unemployment
Male Unemployment Comparison
Croatians
Peruvians
4.9%
MALE UNEMPLOYMENT
98.9/ 100
METRIC RATING
50th/ 347
METRIC RANK
5.3%
MALE UNEMPLOYMENT
51.9/ 100
METRIC RATING
171st/ 347
METRIC RANK
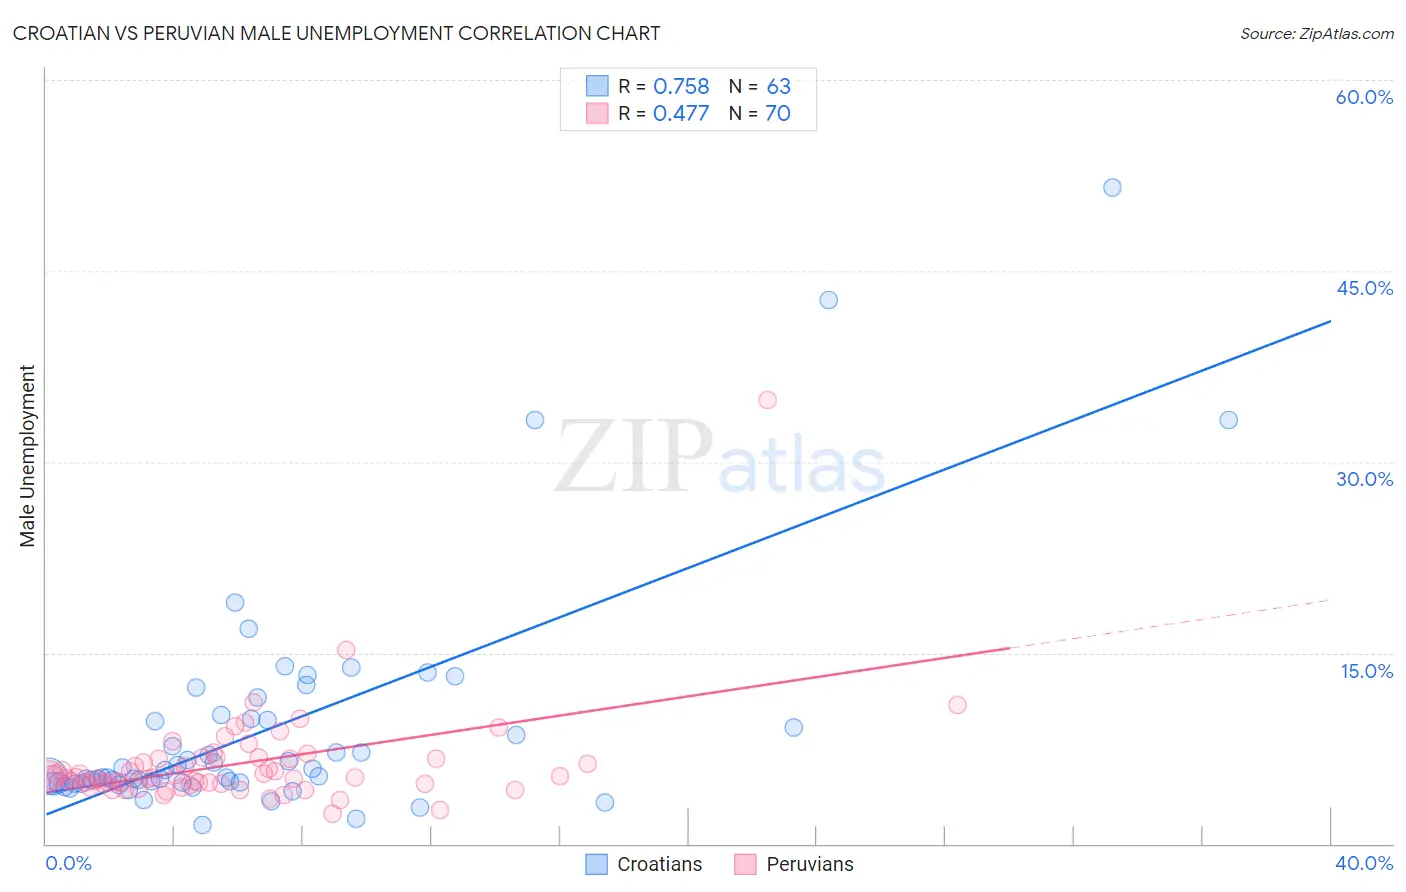
Croatian vs Peruvian Male Unemployment Correlation Chart
The statistical analysis conducted on geographies consisting of 374,058,909 people shows a strong positive correlation between the proportion of Croatians and unemployment rate among males in the United States with a correlation coefficient (R) of 0.758 and weighted average of 4.9%. Similarly, the statistical analysis conducted on geographies consisting of 362,248,150 people shows a moderate positive correlation between the proportion of Peruvians and unemployment rate among males in the United States with a correlation coefficient (R) of 0.477 and weighted average of 5.3%, a difference of 6.9%.
Male Unemployment Correlation Summary
| Measurement | Croatian | Peruvian |
| Minimum | 1.5% | 2.3% |
| Maximum | 51.6% | 34.9% |
| Range | 50.1% | 32.6% |
| Mean | 9.1% | 6.3% |
| Median | 5.3% | 5.2% |
| Interquartile 25% (IQ1) | 4.8% | 4.7% |
| Interquartile 75% (IQ3) | 9.8% | 6.7% |
| Interquartile Range (IQR) | 5.0% | 2.0% |
| Standard Deviation (Sample) | 9.1% | 4.1% |
| Standard Deviation (Population) | 9.1% | 4.0% |
Similar Demographics by Male Unemployment
Demographics Similar to Croatians by Male Unemployment
In terms of male unemployment, the demographic groups most similar to Croatians are Polish (4.9%, a difference of 0.010%), Immigrants from Scotland (4.9%, a difference of 0.020%), Austrian (4.9%, a difference of 0.040%), Slovene (5.0%, a difference of 0.040%), and Irish (5.0%, a difference of 0.060%).
| Demographics | Rating | Rank | Male Unemployment |
| Immigrants | Japan | 99.2 /100 | #43 | Exceptional 4.9% |
| Immigrants | Korea | 99.1 /100 | #44 | Exceptional 4.9% |
| Immigrants | Zimbabwe | 99.0 /100 | #45 | Exceptional 4.9% |
| Bhutanese | 98.9 /100 | #46 | Exceptional 4.9% |
| Austrians | 98.9 /100 | #47 | Exceptional 4.9% |
| Immigrants | Scotland | 98.9 /100 | #48 | Exceptional 4.9% |
| Poles | 98.9 /100 | #49 | Exceptional 4.9% |
| Croatians | 98.9 /100 | #50 | Exceptional 4.9% |
| Slovenes | 98.8 /100 | #51 | Exceptional 5.0% |
| Irish | 98.8 /100 | #52 | Exceptional 5.0% |
| Jordanians | 98.8 /100 | #53 | Exceptional 5.0% |
| Yugoslavians | 98.7 /100 | #54 | Exceptional 5.0% |
| Czechoslovakians | 98.7 /100 | #55 | Exceptional 5.0% |
| Immigrants | Bulgaria | 98.7 /100 | #56 | Exceptional 5.0% |
| Turks | 98.5 /100 | #57 | Exceptional 5.0% |
Demographics Similar to Peruvians by Male Unemployment
In terms of male unemployment, the demographic groups most similar to Peruvians are Immigrants from Kazakhstan (5.3%, a difference of 0.060%), Immigrants from Russia (5.3%, a difference of 0.070%), Immigrants from Iran (5.3%, a difference of 0.11%), Immigrants from Eastern Europe (5.3%, a difference of 0.13%), and Immigrants from Iraq (5.3%, a difference of 0.22%).
| Demographics | Rating | Rank | Male Unemployment |
| Afghans | 62.0 /100 | #164 | Good 5.3% |
| South Americans | 60.6 /100 | #165 | Good 5.3% |
| Immigrants | Morocco | 60.2 /100 | #166 | Good 5.3% |
| Immigrants | Vietnam | 58.1 /100 | #167 | Average 5.3% |
| Immigrants | Ireland | 57.7 /100 | #168 | Average 5.3% |
| Immigrants | Congo | 57.4 /100 | #169 | Average 5.3% |
| Immigrants | Eastern Europe | 54.1 /100 | #170 | Average 5.3% |
| Peruvians | 51.9 /100 | #171 | Average 5.3% |
| Immigrants | Kazakhstan | 50.8 /100 | #172 | Average 5.3% |
| Immigrants | Russia | 50.7 /100 | #173 | Average 5.3% |
| Immigrants | Iran | 50.0 /100 | #174 | Average 5.3% |
| Immigrants | Iraq | 48.1 /100 | #175 | Average 5.3% |
| Immigrants | Poland | 46.0 /100 | #176 | Average 5.3% |
| Immigrants | Peru | 44.6 /100 | #177 | Average 5.3% |
| Osage | 42.5 /100 | #178 | Average 5.3% |