South African vs Peruvian Male Unemployment
COMPARE
South African
Peruvian
Male Unemployment
Male Unemployment Comparison
South Africans
Peruvians
5.0%
MALE UNEMPLOYMENT
96.4/ 100
METRIC RATING
79th/ 347
METRIC RANK
5.3%
MALE UNEMPLOYMENT
51.9/ 100
METRIC RATING
171st/ 347
METRIC RANK
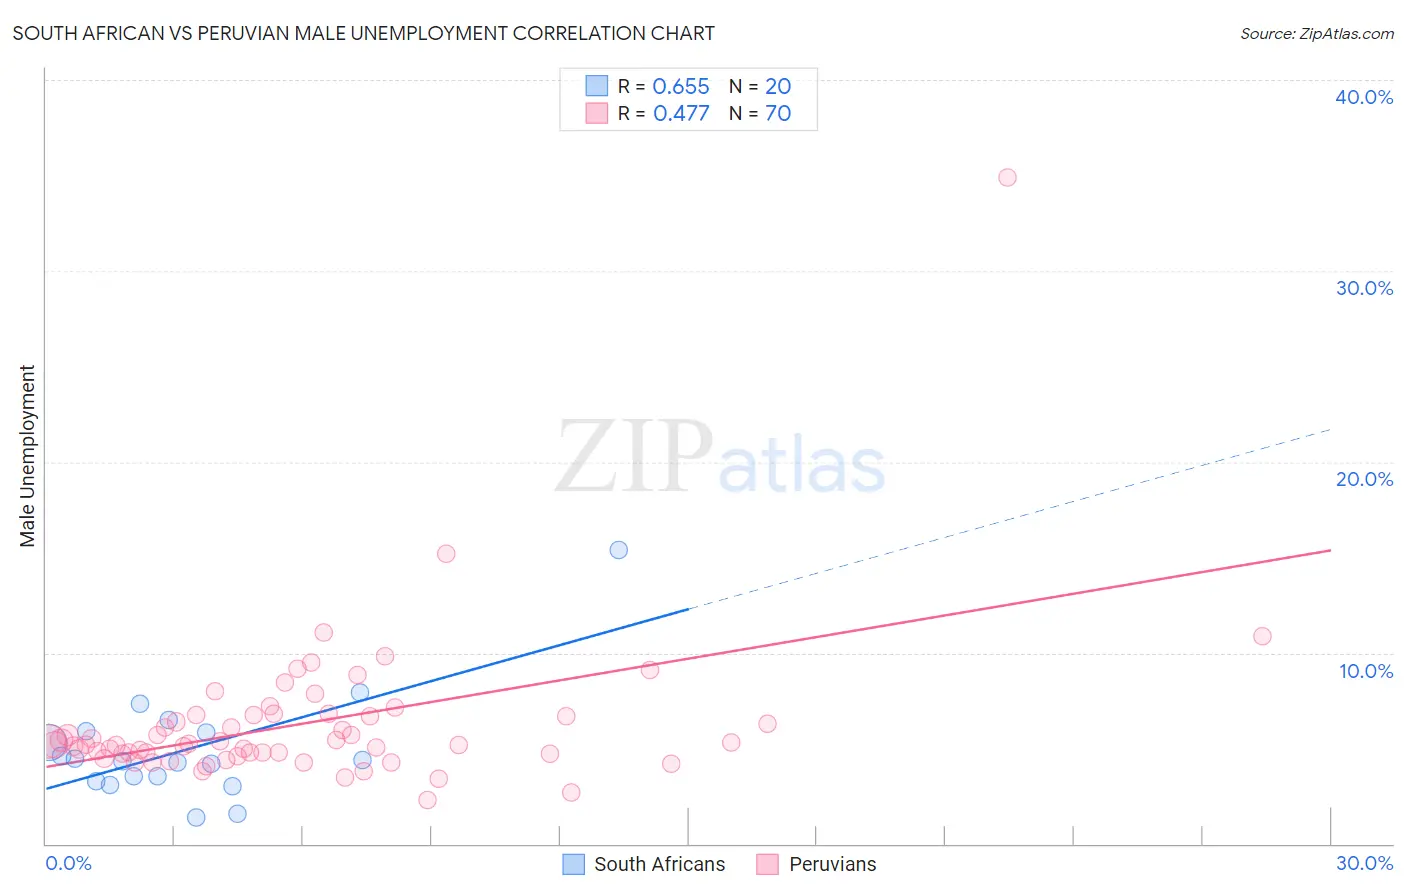
South African vs Peruvian Male Unemployment Correlation Chart
The statistical analysis conducted on geographies consisting of 182,243,943 people shows a significant positive correlation between the proportion of South Africans and unemployment rate among males in the United States with a correlation coefficient (R) of 0.655 and weighted average of 5.0%. Similarly, the statistical analysis conducted on geographies consisting of 362,248,150 people shows a moderate positive correlation between the proportion of Peruvians and unemployment rate among males in the United States with a correlation coefficient (R) of 0.477 and weighted average of 5.3%, a difference of 4.9%.
Male Unemployment Correlation Summary
| Measurement | South African | Peruvian |
| Minimum | 1.4% | 2.3% |
| Maximum | 15.4% | 34.9% |
| Range | 14.0% | 32.6% |
| Mean | 5.0% | 6.3% |
| Median | 4.4% | 5.2% |
| Interquartile 25% (IQ1) | 3.4% | 4.7% |
| Interquartile 75% (IQ3) | 5.9% | 6.7% |
| Interquartile Range (IQR) | 2.4% | 2.0% |
| Standard Deviation (Sample) | 3.0% | 4.1% |
| Standard Deviation (Population) | 2.9% | 4.0% |
Similar Demographics by Male Unemployment
Demographics Similar to South Africans by Male Unemployment
In terms of male unemployment, the demographic groups most similar to South Africans are Immigrants from Northern Europe (5.0%, a difference of 0.010%), Iranian (5.0%, a difference of 0.020%), Argentinean (5.0%, a difference of 0.050%), French (5.0%, a difference of 0.050%), and Immigrants from Sudan (5.0%, a difference of 0.070%).
| Demographics | Rating | Rank | Male Unemployment |
| Immigrants | South Africa | 97.1 /100 | #72 | Exceptional 5.0% |
| Greeks | 97.0 /100 | #73 | Exceptional 5.0% |
| Immigrants | North America | 96.9 /100 | #74 | Exceptional 5.0% |
| Assyrians/Chaldeans/Syriacs | 96.9 /100 | #75 | Exceptional 5.0% |
| Immigrants | Sudan | 96.5 /100 | #76 | Exceptional 5.0% |
| Iranians | 96.4 /100 | #77 | Exceptional 5.0% |
| Immigrants | Northern Europe | 96.4 /100 | #78 | Exceptional 5.0% |
| South Africans | 96.4 /100 | #79 | Exceptional 5.0% |
| Argentineans | 96.2 /100 | #80 | Exceptional 5.0% |
| French | 96.2 /100 | #81 | Exceptional 5.0% |
| Chileans | 96.2 /100 | #82 | Exceptional 5.0% |
| Immigrants | Eritrea | 96.0 /100 | #83 | Exceptional 5.0% |
| Serbians | 95.7 /100 | #84 | Exceptional 5.1% |
| Immigrants | North Macedonia | 95.6 /100 | #85 | Exceptional 5.1% |
| Maltese | 95.5 /100 | #86 | Exceptional 5.1% |
Demographics Similar to Peruvians by Male Unemployment
In terms of male unemployment, the demographic groups most similar to Peruvians are Immigrants from Kazakhstan (5.3%, a difference of 0.060%), Immigrants from Russia (5.3%, a difference of 0.070%), Immigrants from Iran (5.3%, a difference of 0.11%), Immigrants from Eastern Europe (5.3%, a difference of 0.13%), and Immigrants from Iraq (5.3%, a difference of 0.22%).
| Demographics | Rating | Rank | Male Unemployment |
| Afghans | 62.0 /100 | #164 | Good 5.3% |
| South Americans | 60.6 /100 | #165 | Good 5.3% |
| Immigrants | Morocco | 60.2 /100 | #166 | Good 5.3% |
| Immigrants | Vietnam | 58.1 /100 | #167 | Average 5.3% |
| Immigrants | Ireland | 57.7 /100 | #168 | Average 5.3% |
| Immigrants | Congo | 57.4 /100 | #169 | Average 5.3% |
| Immigrants | Eastern Europe | 54.1 /100 | #170 | Average 5.3% |
| Peruvians | 51.9 /100 | #171 | Average 5.3% |
| Immigrants | Kazakhstan | 50.8 /100 | #172 | Average 5.3% |
| Immigrants | Russia | 50.7 /100 | #173 | Average 5.3% |
| Immigrants | Iran | 50.0 /100 | #174 | Average 5.3% |
| Immigrants | Iraq | 48.1 /100 | #175 | Average 5.3% |
| Immigrants | Poland | 46.0 /100 | #176 | Average 5.3% |
| Immigrants | Peru | 44.6 /100 | #177 | Average 5.3% |
| Osage | 42.5 /100 | #178 | Average 5.3% |