Dutch vs Immigrants from North America Unemployment Among Ages 25 to 29 years
COMPARE
Dutch
Immigrants from North America
Unemployment Among Ages 25 to 29 years
Unemployment Among Ages 25 to 29 years Comparison
Dutch
Immigrants from North America
6.5%
UNEMPLOYMENT AMONG AGES 25 TO 29 YEARS
80.6/ 100
METRIC RATING
127th/ 347
METRIC RANK
6.6%
UNEMPLOYMENT AMONG AGES 25 TO 29 YEARS
50.0/ 100
METRIC RATING
174th/ 347
METRIC RANK
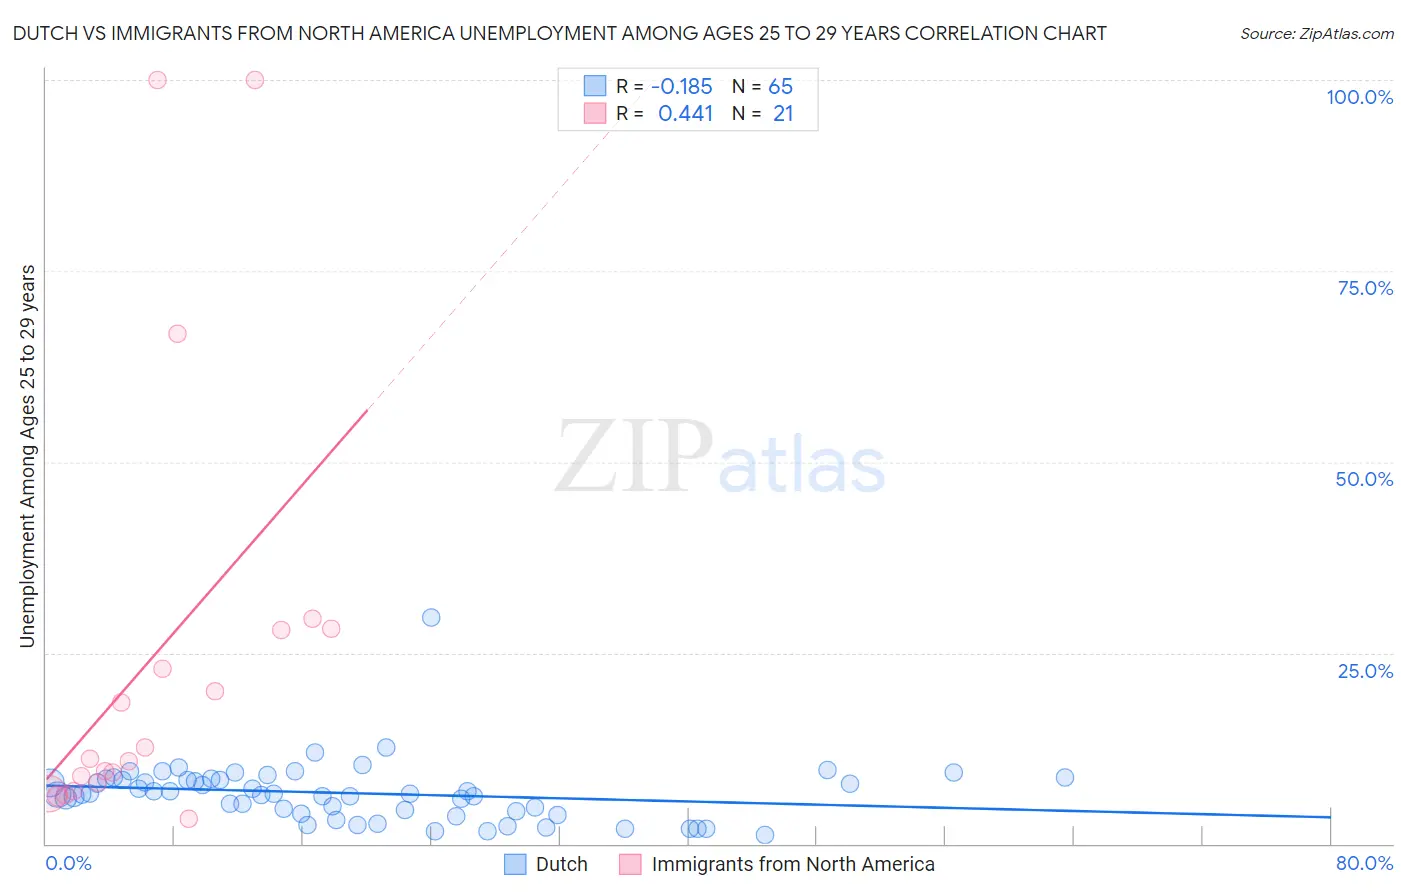
Dutch vs Immigrants from North America Unemployment Among Ages 25 to 29 years Correlation Chart
The statistical analysis conducted on geographies consisting of 494,818,360 people shows a poor negative correlation between the proportion of Dutch and unemployment rate among population between the ages 25 and 29 in the United States with a correlation coefficient (R) of -0.185 and weighted average of 6.5%. Similarly, the statistical analysis conducted on geographies consisting of 430,461,611 people shows a moderate positive correlation between the proportion of Immigrants from North America and unemployment rate among population between the ages 25 and 29 in the United States with a correlation coefficient (R) of 0.441 and weighted average of 6.6%, a difference of 2.2%.
Unemployment Among Ages 25 to 29 years Correlation Summary
| Measurement | Dutch | Immigrants from North America |
| Minimum | 1.1% | 3.2% |
| Maximum | 29.6% | 100.0% |
| Range | 28.5% | 96.8% |
| Mean | 6.6% | 24.4% |
| Median | 6.5% | 11.1% |
| Interquartile 25% (IQ1) | 4.0% | 7.4% |
| Interquartile 75% (IQ3) | 8.4% | 28.1% |
| Interquartile Range (IQR) | 4.4% | 20.6% |
| Standard Deviation (Sample) | 4.0% | 28.7% |
| Standard Deviation (Population) | 4.0% | 28.0% |
Similar Demographics by Unemployment Among Ages 25 to 29 years
Demographics Similar to Dutch by Unemployment Among Ages 25 to 29 years
In terms of unemployment among ages 25 to 29 years, the demographic groups most similar to Dutch are Immigrants from Chile (6.5%, a difference of 0.020%), Sri Lankan (6.5%, a difference of 0.040%), Immigrants from Peru (6.5%, a difference of 0.070%), Brazilian (6.5%, a difference of 0.13%), and Immigrants from Afghanistan (6.5%, a difference of 0.14%).
| Demographics | Rating | Rank | Unemployment Among Ages 25 to 29 years |
| Immigrants | Moldova | 84.5 /100 | #120 | Excellent 6.5% |
| Immigrants | Uganda | 84.5 /100 | #121 | Excellent 6.5% |
| Immigrants | Belarus | 83.7 /100 | #122 | Excellent 6.5% |
| Laotians | 83.6 /100 | #123 | Excellent 6.5% |
| Arabs | 82.5 /100 | #124 | Excellent 6.5% |
| Syrians | 82.1 /100 | #125 | Excellent 6.5% |
| Brazilians | 81.9 /100 | #126 | Excellent 6.5% |
| Dutch | 80.6 /100 | #127 | Excellent 6.5% |
| Immigrants | Chile | 80.5 /100 | #128 | Excellent 6.5% |
| Sri Lankans | 80.3 /100 | #129 | Excellent 6.5% |
| Immigrants | Peru | 79.9 /100 | #130 | Good 6.5% |
| Immigrants | Afghanistan | 79.2 /100 | #131 | Good 6.5% |
| Poles | 76.6 /100 | #132 | Good 6.5% |
| Immigrants | Europe | 75.7 /100 | #133 | Good 6.5% |
| Immigrants | Vietnam | 75.6 /100 | #134 | Good 6.5% |
Demographics Similar to Immigrants from North America by Unemployment Among Ages 25 to 29 years
In terms of unemployment among ages 25 to 29 years, the demographic groups most similar to Immigrants from North America are Immigrants from South Eastern Asia (6.7%, a difference of 0.060%), Russian (6.6%, a difference of 0.080%), Bangladeshi (6.6%, a difference of 0.10%), Osage (6.7%, a difference of 0.12%), and Immigrants from Israel (6.7%, a difference of 0.14%).
| Demographics | Rating | Rank | Unemployment Among Ages 25 to 29 years |
| Immigrants | Canada | 55.0 /100 | #167 | Average 6.6% |
| Estonians | 54.8 /100 | #168 | Average 6.6% |
| South Americans | 54.5 /100 | #169 | Average 6.6% |
| Albanians | 53.5 /100 | #170 | Average 6.6% |
| Immigrants | Cambodia | 52.6 /100 | #171 | Average 6.6% |
| Bangladeshis | 51.6 /100 | #172 | Average 6.6% |
| Russians | 51.3 /100 | #173 | Average 6.6% |
| Immigrants | North America | 50.0 /100 | #174 | Average 6.6% |
| Immigrants | South Eastern Asia | 49.1 /100 | #175 | Average 6.7% |
| Osage | 48.1 /100 | #176 | Average 6.7% |
| Immigrants | Israel | 47.8 /100 | #177 | Average 6.7% |
| Immigrants | Iraq | 45.1 /100 | #178 | Average 6.7% |
| Costa Ricans | 44.9 /100 | #179 | Average 6.7% |
| Immigrants | Africa | 41.1 /100 | #180 | Average 6.7% |
| Immigrants | Western Europe | 41.1 /100 | #181 | Average 6.7% |