Dutch vs Ghanaian Unemployment Among Ages 25 to 29 years
COMPARE
Dutch
Ghanaian
Unemployment Among Ages 25 to 29 years
Unemployment Among Ages 25 to 29 years Comparison
Dutch
Ghanaians
6.5%
UNEMPLOYMENT AMONG AGES 25 TO 29 YEARS
80.6/ 100
METRIC RATING
127th/ 347
METRIC RANK
7.2%
UNEMPLOYMENT AMONG AGES 25 TO 29 YEARS
0.3/ 100
METRIC RATING
254th/ 347
METRIC RANK
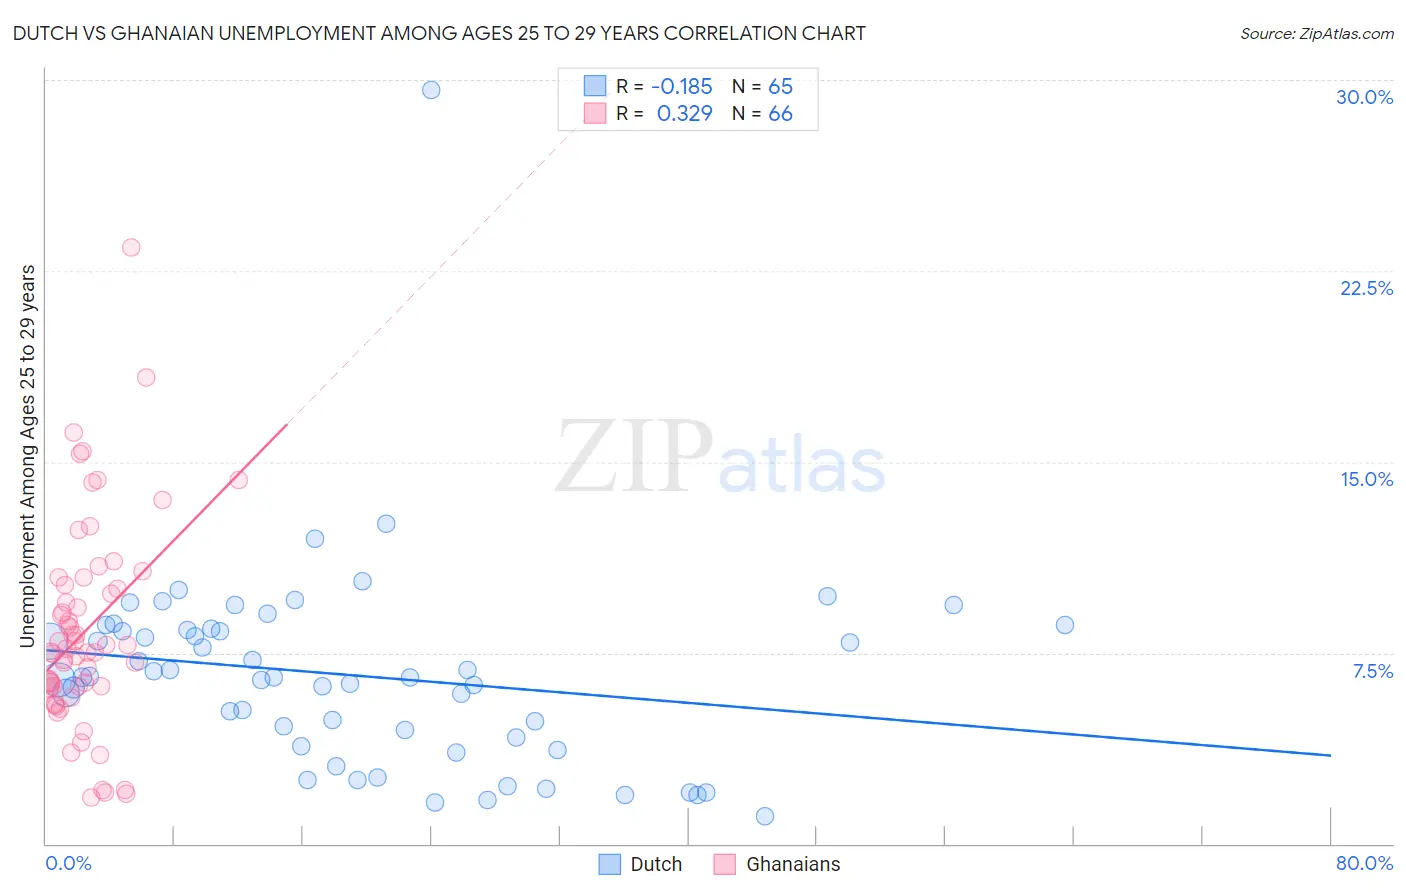
Dutch vs Ghanaian Unemployment Among Ages 25 to 29 years Correlation Chart
The statistical analysis conducted on geographies consisting of 494,818,360 people shows a poor negative correlation between the proportion of Dutch and unemployment rate among population between the ages 25 and 29 in the United States with a correlation coefficient (R) of -0.185 and weighted average of 6.5%. Similarly, the statistical analysis conducted on geographies consisting of 187,167,021 people shows a mild positive correlation between the proportion of Ghanaians and unemployment rate among population between the ages 25 and 29 in the United States with a correlation coefficient (R) of 0.329 and weighted average of 7.2%, a difference of 11.4%.
Unemployment Among Ages 25 to 29 years Correlation Summary
| Measurement | Dutch | Ghanaian |
| Minimum | 1.1% | 1.8% |
| Maximum | 29.6% | 23.4% |
| Range | 28.5% | 21.6% |
| Mean | 6.6% | 8.4% |
| Median | 6.5% | 7.6% |
| Interquartile 25% (IQ1) | 4.0% | 6.2% |
| Interquartile 75% (IQ3) | 8.4% | 10.2% |
| Interquartile Range (IQR) | 4.4% | 4.0% |
| Standard Deviation (Sample) | 4.0% | 4.1% |
| Standard Deviation (Population) | 4.0% | 4.0% |
Similar Demographics by Unemployment Among Ages 25 to 29 years
Demographics Similar to Dutch by Unemployment Among Ages 25 to 29 years
In terms of unemployment among ages 25 to 29 years, the demographic groups most similar to Dutch are Immigrants from Chile (6.5%, a difference of 0.020%), Sri Lankan (6.5%, a difference of 0.040%), Immigrants from Peru (6.5%, a difference of 0.070%), Brazilian (6.5%, a difference of 0.13%), and Immigrants from Afghanistan (6.5%, a difference of 0.14%).
| Demographics | Rating | Rank | Unemployment Among Ages 25 to 29 years |
| Immigrants | Moldova | 84.5 /100 | #120 | Excellent 6.5% |
| Immigrants | Uganda | 84.5 /100 | #121 | Excellent 6.5% |
| Immigrants | Belarus | 83.7 /100 | #122 | Excellent 6.5% |
| Laotians | 83.6 /100 | #123 | Excellent 6.5% |
| Arabs | 82.5 /100 | #124 | Excellent 6.5% |
| Syrians | 82.1 /100 | #125 | Excellent 6.5% |
| Brazilians | 81.9 /100 | #126 | Excellent 6.5% |
| Dutch | 80.6 /100 | #127 | Excellent 6.5% |
| Immigrants | Chile | 80.5 /100 | #128 | Excellent 6.5% |
| Sri Lankans | 80.3 /100 | #129 | Excellent 6.5% |
| Immigrants | Peru | 79.9 /100 | #130 | Good 6.5% |
| Immigrants | Afghanistan | 79.2 /100 | #131 | Good 6.5% |
| Poles | 76.6 /100 | #132 | Good 6.5% |
| Immigrants | Europe | 75.7 /100 | #133 | Good 6.5% |
| Immigrants | Vietnam | 75.6 /100 | #134 | Good 6.5% |
Demographics Similar to Ghanaians by Unemployment Among Ages 25 to 29 years
In terms of unemployment among ages 25 to 29 years, the demographic groups most similar to Ghanaians are Immigrants from Cameroon (7.2%, a difference of 0.060%), Immigrants from Portugal (7.2%, a difference of 0.15%), Mexican American Indian (7.3%, a difference of 0.26%), Sierra Leonean (7.2%, a difference of 0.47%), and Assyrian/Chaldean/Syriac (7.3%, a difference of 0.63%).
| Demographics | Rating | Rank | Unemployment Among Ages 25 to 29 years |
| Immigrants | Guatemala | 0.7 /100 | #247 | Tragic 7.2% |
| Sub-Saharan Africans | 0.6 /100 | #248 | Tragic 7.2% |
| Seminole | 0.6 /100 | #249 | Tragic 7.2% |
| Delaware | 0.5 /100 | #250 | Tragic 7.2% |
| Portuguese | 0.5 /100 | #251 | Tragic 7.2% |
| Sierra Leoneans | 0.4 /100 | #252 | Tragic 7.2% |
| Immigrants | Portugal | 0.3 /100 | #253 | Tragic 7.2% |
| Ghanaians | 0.3 /100 | #254 | Tragic 7.2% |
| Immigrants | Cameroon | 0.3 /100 | #255 | Tragic 7.2% |
| Mexican American Indians | 0.3 /100 | #256 | Tragic 7.3% |
| Assyrians/Chaldeans/Syriacs | 0.2 /100 | #257 | Tragic 7.3% |
| Ottawa | 0.1 /100 | #258 | Tragic 7.3% |
| Cree | 0.1 /100 | #259 | Tragic 7.3% |
| Americans | 0.1 /100 | #260 | Tragic 7.4% |
| Nigerians | 0.1 /100 | #261 | Tragic 7.4% |