Immigrants from West Indies vs Senegalese Female Unemployment
COMPARE
Immigrants from West Indies
Senegalese
Female Unemployment
Female Unemployment Comparison
Immigrants from West Indies
Senegalese
6.1%
FEMALE UNEMPLOYMENT
0.0/ 100
METRIC RATING
291st/ 347
METRIC RANK
6.0%
FEMALE UNEMPLOYMENT
0.0/ 100
METRIC RATING
275th/ 347
METRIC RANK
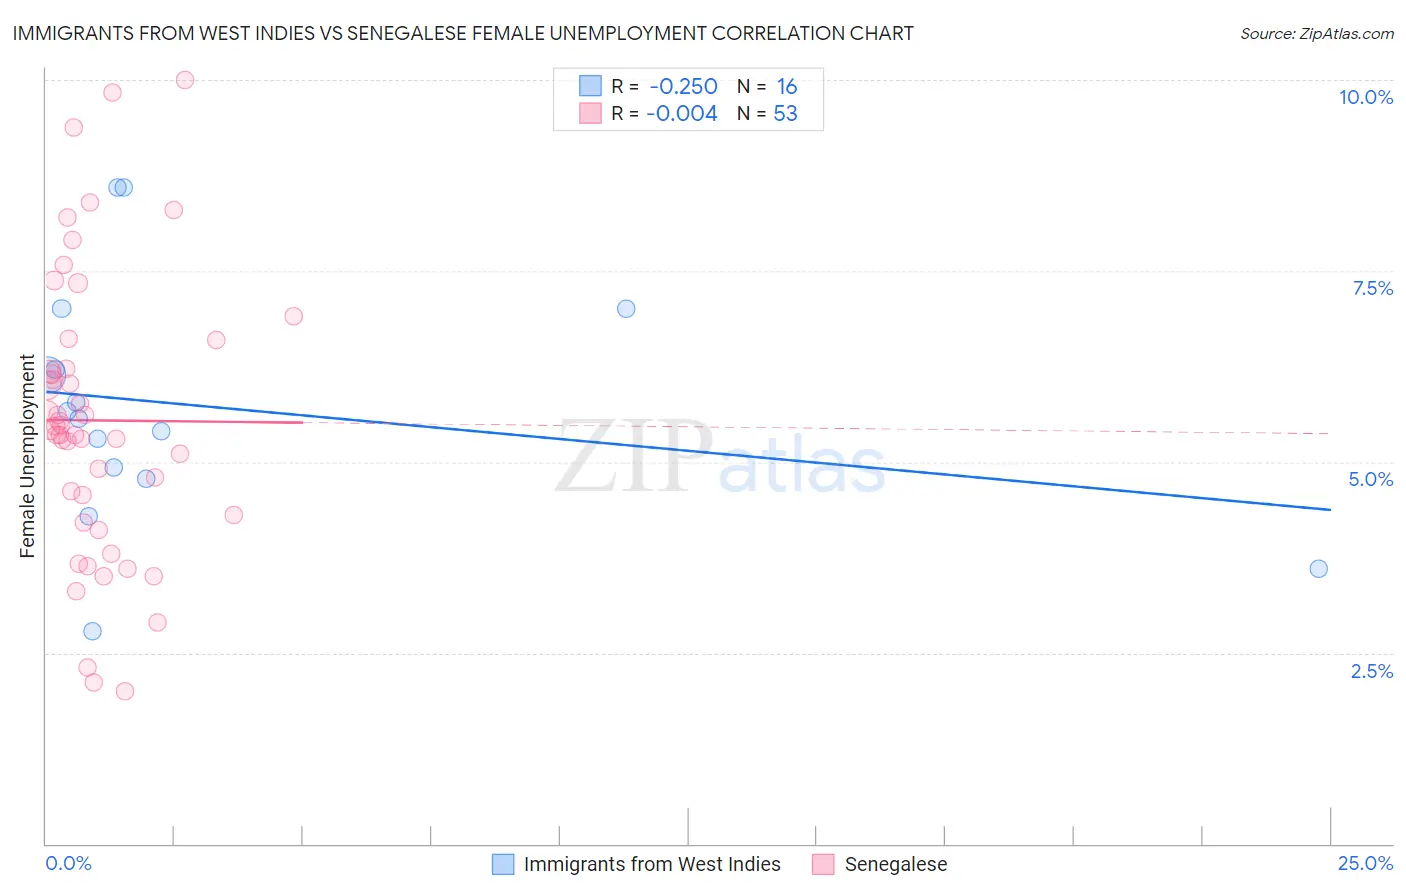
Immigrants from West Indies vs Senegalese Female Unemployment Correlation Chart
The statistical analysis conducted on geographies consisting of 72,427,416 people shows a weak negative correlation between the proportion of Immigrants from West Indies and unemploymnet rate among females in the United States with a correlation coefficient (R) of -0.250 and weighted average of 6.1%. Similarly, the statistical analysis conducted on geographies consisting of 78,123,834 people shows no correlation between the proportion of Senegalese and unemploymnet rate among females in the United States with a correlation coefficient (R) of -0.004 and weighted average of 6.0%, a difference of 2.0%.
Female Unemployment Correlation Summary
| Measurement | Immigrants from West Indies | Senegalese |
| Minimum | 2.8% | 2.0% |
| Maximum | 8.6% | 10.0% |
| Range | 5.8% | 8.0% |
| Mean | 5.7% | 5.5% |
| Median | 5.6% | 5.4% |
| Interquartile 25% (IQ1) | 4.9% | 4.3% |
| Interquartile 75% (IQ3) | 6.6% | 6.4% |
| Interquartile Range (IQR) | 1.8% | 2.2% |
| Standard Deviation (Sample) | 1.6% | 1.8% |
| Standard Deviation (Population) | 1.5% | 1.8% |
Demographics Similar to Immigrants from West Indies and Senegalese by Female Unemployment
In terms of female unemployment, the demographic groups most similar to Immigrants from West Indies are Immigrants from Trinidad and Tobago (6.1%, a difference of 0.060%), Immigrants from Caribbean (6.1%, a difference of 0.11%), Mexican (6.1%, a difference of 0.15%), Trinidadian and Tobagonian (6.1%, a difference of 0.17%), and Haitian (6.1%, a difference of 0.18%). Similarly, the demographic groups most similar to Senegalese are Bahamian (6.0%, a difference of 0.040%), Immigrants from Ghana (6.0%, a difference of 0.43%), Yaqui (6.0%, a difference of 0.43%), African (5.9%, a difference of 0.49%), and Armenian (6.0%, a difference of 0.55%).
| Demographics | Rating | Rank | Female Unemployment |
| Ghanaians | 0.0 /100 | #273 | Tragic 5.9% |
| Africans | 0.0 /100 | #274 | Tragic 5.9% |
| Senegalese | 0.0 /100 | #275 | Tragic 6.0% |
| Bahamians | 0.0 /100 | #276 | Tragic 6.0% |
| Immigrants | Ghana | 0.0 /100 | #277 | Tragic 6.0% |
| Yaqui | 0.0 /100 | #278 | Tragic 6.0% |
| Armenians | 0.0 /100 | #279 | Tragic 6.0% |
| Mexican American Indians | 0.0 /100 | #280 | Tragic 6.0% |
| Guatemalans | 0.0 /100 | #281 | Tragic 6.0% |
| Colville | 0.0 /100 | #282 | Tragic 6.0% |
| Salvadorans | 0.0 /100 | #283 | Tragic 6.0% |
| Immigrants | Senegal | 0.0 /100 | #284 | Tragic 6.1% |
| Immigrants | Cabo Verde | 0.0 /100 | #285 | Tragic 6.1% |
| Chippewa | 0.0 /100 | #286 | Tragic 6.1% |
| Immigrants | Guatemala | 0.0 /100 | #287 | Tragic 6.1% |
| Haitians | 0.0 /100 | #288 | Tragic 6.1% |
| Trinidadians and Tobagonians | 0.0 /100 | #289 | Tragic 6.1% |
| Immigrants | Caribbean | 0.0 /100 | #290 | Tragic 6.1% |
| Immigrants | West Indies | 0.0 /100 | #291 | Tragic 6.1% |
| Immigrants | Trinidad and Tobago | 0.0 /100 | #292 | Tragic 6.1% |
| Mexicans | 0.0 /100 | #293 | Tragic 6.1% |