Immigrants from Romania vs Immigrants from Northern Africa Unemployment Among Women with Children Under 6 years
COMPARE
Immigrants from Romania
Immigrants from Northern Africa
Unemployment Among Women with Children Under 6 years
Unemployment Among Women with Children Under 6 years Comparison
Immigrants from Romania
Immigrants from Northern Africa
7.1%
UNEMPLOYMENT AMONG WOMEN WITH CHILDREN UNDER 6 YEARS
98.7/ 100
METRIC RATING
85th/ 347
METRIC RANK
7.4%
UNEMPLOYMENT AMONG WOMEN WITH CHILDREN UNDER 6 YEARS
85.3/ 100
METRIC RATING
135th/ 347
METRIC RANK
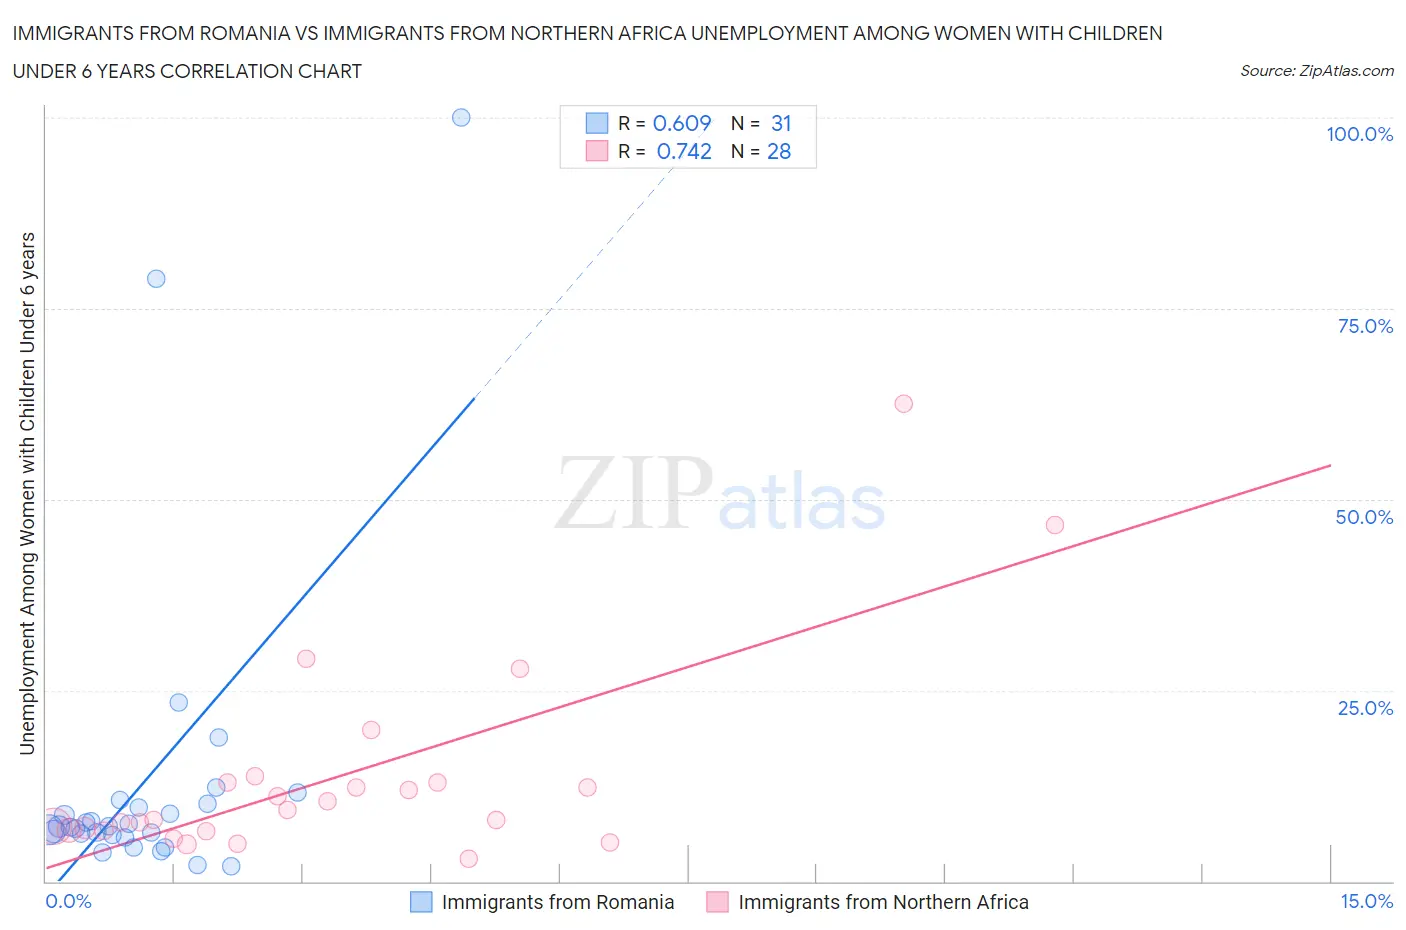
Immigrants from Romania vs Immigrants from Northern Africa Unemployment Among Women with Children Under 6 years Correlation Chart
The statistical analysis conducted on geographies consisting of 209,184,767 people shows a significant positive correlation between the proportion of Immigrants from Romania and unemployment rate among women with children under the age of 6 in the United States with a correlation coefficient (R) of 0.609 and weighted average of 7.1%. Similarly, the statistical analysis conducted on geographies consisting of 256,290,723 people shows a strong positive correlation between the proportion of Immigrants from Northern Africa and unemployment rate among women with children under the age of 6 in the United States with a correlation coefficient (R) of 0.742 and weighted average of 7.4%, a difference of 4.5%.
Unemployment Among Women with Children Under 6 years Correlation Summary
| Measurement | Immigrants from Romania | Immigrants from Northern Africa |
| Minimum | 1.9% | 2.9% |
| Maximum | 100.0% | 62.5% |
| Range | 98.1% | 59.6% |
| Mean | 13.2% | 13.6% |
| Median | 7.1% | 8.7% |
| Interquartile 25% (IQ1) | 6.1% | 6.6% |
| Interquartile 75% (IQ3) | 10.1% | 12.9% |
| Interquartile Range (IQR) | 4.0% | 6.3% |
| Standard Deviation (Sample) | 21.0% | 13.3% |
| Standard Deviation (Population) | 20.6% | 13.1% |
Similar Demographics by Unemployment Among Women with Children Under 6 years
Demographics Similar to Immigrants from Romania by Unemployment Among Women with Children Under 6 years
In terms of unemployment among women with children under 6 years, the demographic groups most similar to Immigrants from Romania are Immigrants from Albania (7.1%, a difference of 0.040%), Egyptian (7.1%, a difference of 0.090%), Immigrants from Afghanistan (7.1%, a difference of 0.12%), Immigrants from Zimbabwe (7.1%, a difference of 0.13%), and Immigrants from Venezuela (7.1%, a difference of 0.27%).
| Demographics | Rating | Rank | Unemployment Among Women with Children Under 6 years |
| Immigrants | Somalia | 98.9 /100 | #78 | Exceptional 7.1% |
| Immigrants | Fiji | 98.9 /100 | #79 | Exceptional 7.1% |
| Immigrants | Greece | 98.9 /100 | #80 | Exceptional 7.1% |
| Immigrants | Venezuela | 98.8 /100 | #81 | Exceptional 7.1% |
| Immigrants | Afghanistan | 98.7 /100 | #82 | Exceptional 7.1% |
| Egyptians | 98.7 /100 | #83 | Exceptional 7.1% |
| Immigrants | Albania | 98.7 /100 | #84 | Exceptional 7.1% |
| Immigrants | Romania | 98.7 /100 | #85 | Exceptional 7.1% |
| Immigrants | Zimbabwe | 98.6 /100 | #86 | Exceptional 7.1% |
| Alsatians | 98.4 /100 | #87 | Exceptional 7.1% |
| Immigrants | Hungary | 98.3 /100 | #88 | Exceptional 7.1% |
| Immigrants | Denmark | 98.3 /100 | #89 | Exceptional 7.1% |
| Immigrants | Spain | 98.2 /100 | #90 | Exceptional 7.1% |
| Danes | 98.2 /100 | #91 | Exceptional 7.1% |
| Albanians | 98.0 /100 | #92 | Exceptional 7.2% |
Demographics Similar to Immigrants from Northern Africa by Unemployment Among Women with Children Under 6 years
In terms of unemployment among women with children under 6 years, the demographic groups most similar to Immigrants from Northern Africa are Immigrants from Bolivia (7.4%, a difference of 0.060%), Immigrants from Morocco (7.4%, a difference of 0.060%), Immigrants from Cambodia (7.4%, a difference of 0.090%), Immigrants from Uganda (7.4%, a difference of 0.17%), and Immigrants from Norway (7.4%, a difference of 0.17%).
| Demographics | Rating | Rank | Unemployment Among Women with Children Under 6 years |
| Zimbabweans | 91.5 /100 | #128 | Exceptional 7.3% |
| Slovenes | 89.2 /100 | #129 | Excellent 7.4% |
| Swedes | 88.4 /100 | #130 | Excellent 7.4% |
| Ukrainians | 88.2 /100 | #131 | Excellent 7.4% |
| Immigrants | Armenia | 87.4 /100 | #132 | Excellent 7.4% |
| Immigrants | Uganda | 86.5 /100 | #133 | Excellent 7.4% |
| Immigrants | Bolivia | 85.7 /100 | #134 | Excellent 7.4% |
| Immigrants | Northern Africa | 85.3 /100 | #135 | Excellent 7.4% |
| Immigrants | Morocco | 84.9 /100 | #136 | Excellent 7.4% |
| Immigrants | Cambodia | 84.6 /100 | #137 | Excellent 7.4% |
| Immigrants | Norway | 84.1 /100 | #138 | Excellent 7.4% |
| Immigrants | Colombia | 83.9 /100 | #139 | Excellent 7.4% |
| Scandinavians | 83.0 /100 | #140 | Excellent 7.4% |
| Greeks | 82.6 /100 | #141 | Excellent 7.4% |
| Immigrants | Argentina | 81.5 /100 | #142 | Excellent 7.5% |