Immigrants from Italy vs Immigrants from Northern Africa Unemployment Among Women with Children Under 6 years
COMPARE
Immigrants from Italy
Immigrants from Northern Africa
Unemployment Among Women with Children Under 6 years
Unemployment Among Women with Children Under 6 years Comparison
Immigrants from Italy
Immigrants from Northern Africa
7.2%
UNEMPLOYMENT AMONG WOMEN WITH CHILDREN UNDER 6 YEARS
96.1/ 100
METRIC RATING
115th/ 347
METRIC RANK
7.4%
UNEMPLOYMENT AMONG WOMEN WITH CHILDREN UNDER 6 YEARS
85.3/ 100
METRIC RATING
135th/ 347
METRIC RANK
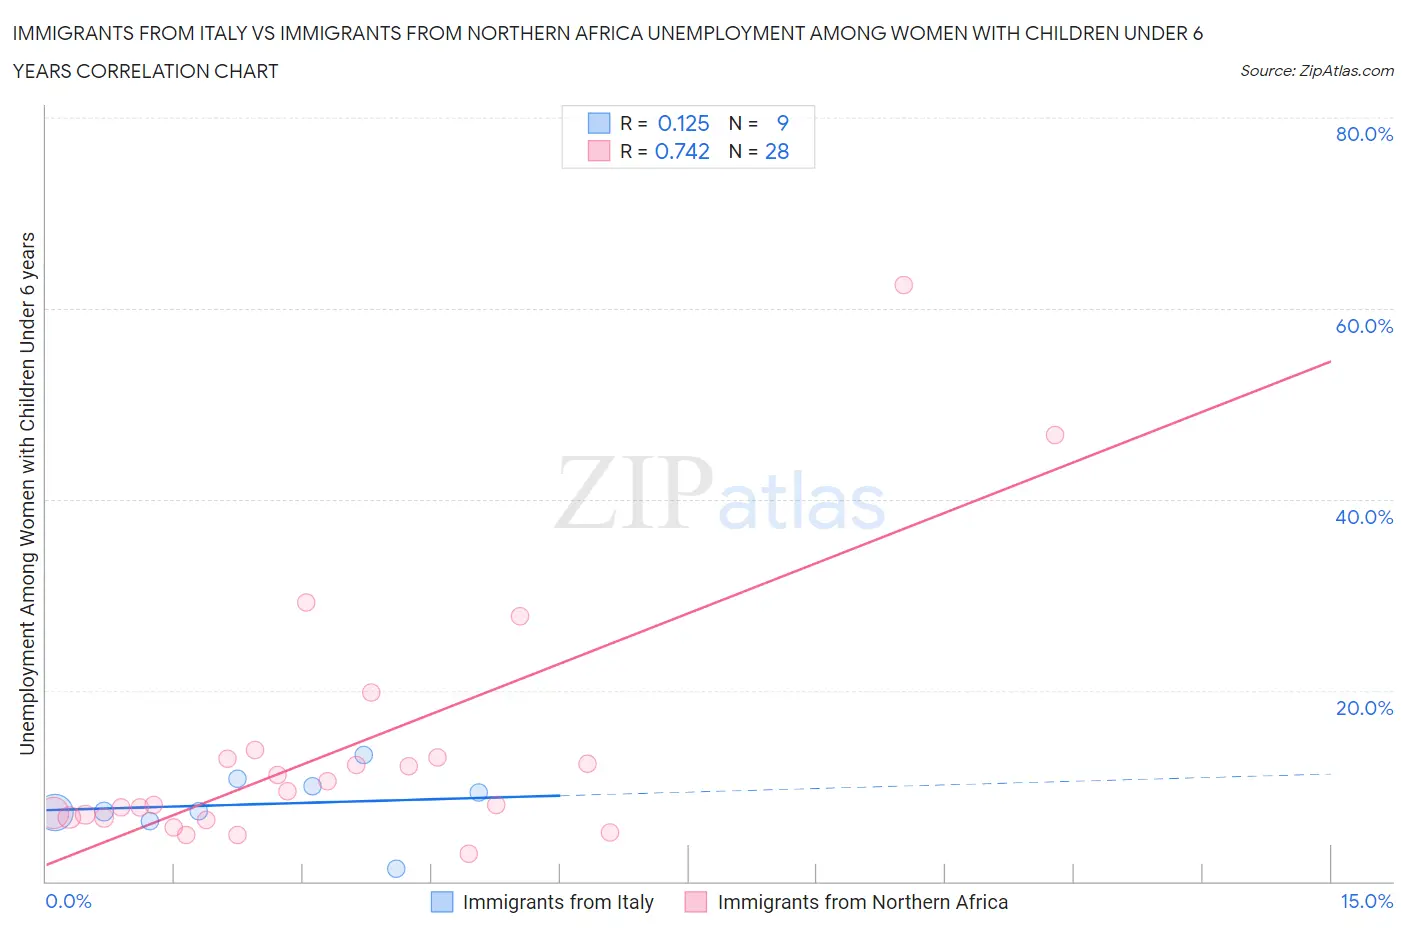
Immigrants from Italy vs Immigrants from Northern Africa Unemployment Among Women with Children Under 6 years Correlation Chart
The statistical analysis conducted on geographies consisting of 250,790,462 people shows a poor positive correlation between the proportion of Immigrants from Italy and unemployment rate among women with children under the age of 6 in the United States with a correlation coefficient (R) of 0.125 and weighted average of 7.2%. Similarly, the statistical analysis conducted on geographies consisting of 256,290,723 people shows a strong positive correlation between the proportion of Immigrants from Northern Africa and unemployment rate among women with children under the age of 6 in the United States with a correlation coefficient (R) of 0.742 and weighted average of 7.4%, a difference of 2.5%.
Unemployment Among Women with Children Under 6 years Correlation Summary
| Measurement | Immigrants from Italy | Immigrants from Northern Africa |
| Minimum | 1.3% | 2.9% |
| Maximum | 13.2% | 62.5% |
| Range | 11.9% | 59.6% |
| Mean | 8.1% | 13.6% |
| Median | 7.4% | 8.7% |
| Interquartile 25% (IQ1) | 6.7% | 6.6% |
| Interquartile 75% (IQ3) | 10.3% | 12.9% |
| Interquartile Range (IQR) | 3.6% | 6.3% |
| Standard Deviation (Sample) | 3.4% | 13.3% |
| Standard Deviation (Population) | 3.2% | 13.1% |
Demographics Similar to Immigrants from Italy and Immigrants from Northern Africa by Unemployment Among Women with Children Under 6 years
In terms of unemployment among women with children under 6 years, the demographic groups most similar to Immigrants from Italy are Armenian (7.2%, a difference of 0.10%), Immigrants from Kenya (7.3%, a difference of 0.30%), Serbian (7.3%, a difference of 0.64%), South African (7.3%, a difference of 0.75%), and Iraqi (7.3%, a difference of 0.82%). Similarly, the demographic groups most similar to Immigrants from Northern Africa are Immigrants from Bolivia (7.4%, a difference of 0.060%), Immigrants from Uganda (7.4%, a difference of 0.17%), Immigrants from Armenia (7.4%, a difference of 0.30%), Ukrainian (7.4%, a difference of 0.43%), and Swedish (7.4%, a difference of 0.46%).
| Demographics | Rating | Rank | Unemployment Among Women with Children Under 6 years |
| Immigrants | Italy | 96.1 /100 | #115 | Exceptional 7.2% |
| Armenians | 95.9 /100 | #116 | Exceptional 7.2% |
| Immigrants | Kenya | 95.4 /100 | #117 | Exceptional 7.3% |
| Serbians | 94.5 /100 | #118 | Exceptional 7.3% |
| South Africans | 94.1 /100 | #119 | Exceptional 7.3% |
| Iraqis | 93.9 /100 | #120 | Exceptional 7.3% |
| Immigrants | Chile | 93.5 /100 | #121 | Exceptional 7.3% |
| Immigrants | Bosnia and Herzegovina | 93.5 /100 | #122 | Exceptional 7.3% |
| Immigrants | Zaire | 93.3 /100 | #123 | Exceptional 7.3% |
| Immigrants | South Africa | 92.5 /100 | #124 | Exceptional 7.3% |
| Pakistanis | 92.2 /100 | #125 | Exceptional 7.3% |
| Immigrants | Burma/Myanmar | 91.9 /100 | #126 | Exceptional 7.3% |
| Jordanians | 91.5 /100 | #127 | Exceptional 7.3% |
| Zimbabweans | 91.5 /100 | #128 | Exceptional 7.3% |
| Slovenes | 89.2 /100 | #129 | Excellent 7.4% |
| Swedes | 88.4 /100 | #130 | Excellent 7.4% |
| Ukrainians | 88.2 /100 | #131 | Excellent 7.4% |
| Immigrants | Armenia | 87.4 /100 | #132 | Excellent 7.4% |
| Immigrants | Uganda | 86.5 /100 | #133 | Excellent 7.4% |
| Immigrants | Bolivia | 85.7 /100 | #134 | Excellent 7.4% |
| Immigrants | Northern Africa | 85.3 /100 | #135 | Excellent 7.4% |