Delaware vs Luxembourger Female Unemployment
COMPARE
Delaware
Luxembourger
Female Unemployment
Female Unemployment Comparison
Delaware
Luxembourgers
5.5%
FEMALE UNEMPLOYMENT
7.2/ 100
METRIC RATING
223rd/ 347
METRIC RANK
4.4%
FEMALE UNEMPLOYMENT
100.0/ 100
METRIC RATING
3rd/ 347
METRIC RANK
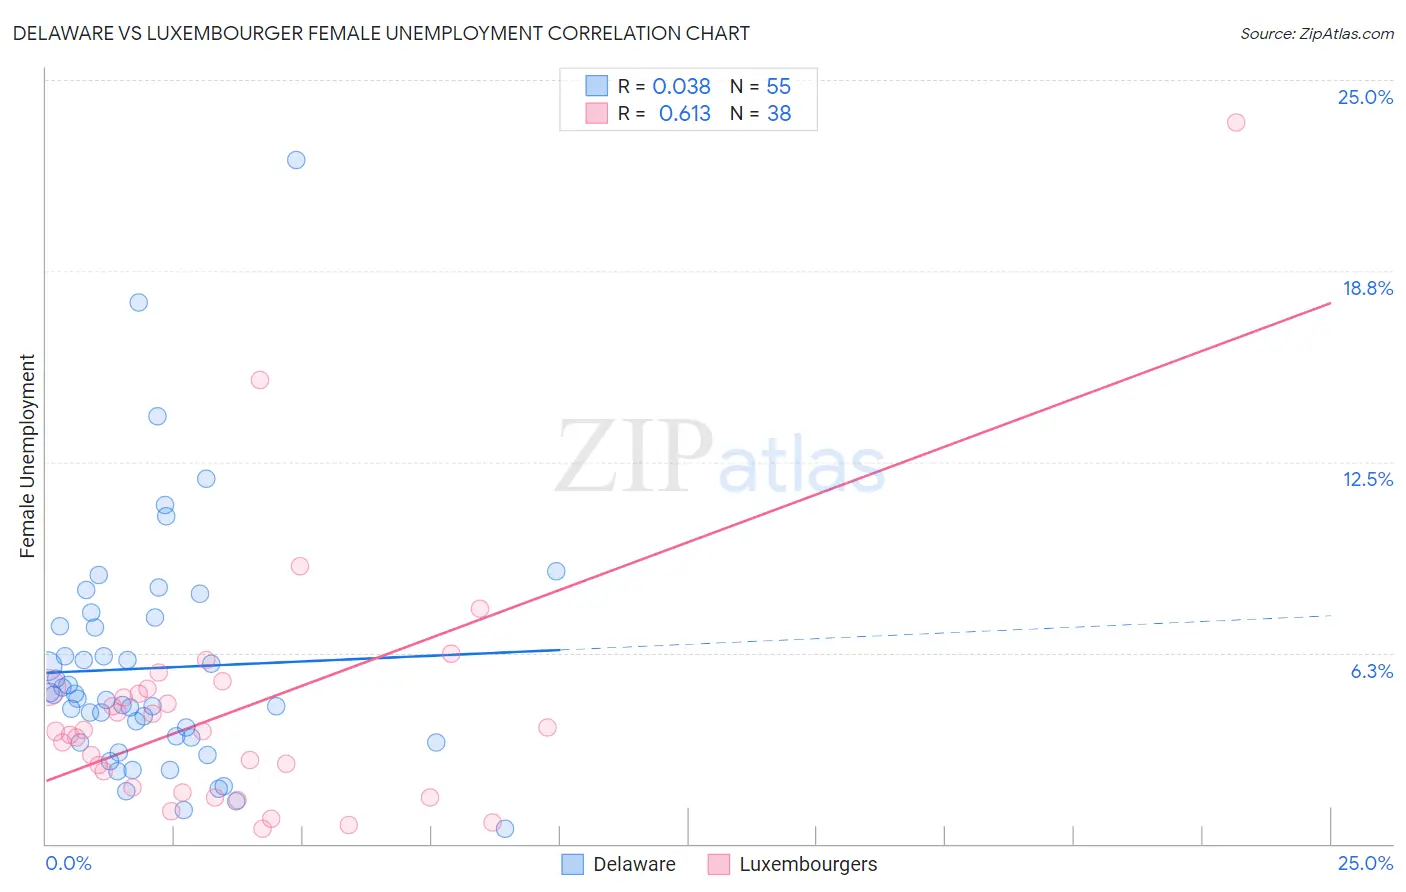
Delaware vs Luxembourger Female Unemployment Correlation Chart
The statistical analysis conducted on geographies consisting of 96,046,928 people shows no correlation between the proportion of Delaware and unemploymnet rate among females in the United States with a correlation coefficient (R) of 0.038 and weighted average of 5.5%. Similarly, the statistical analysis conducted on geographies consisting of 144,033,637 people shows a significant positive correlation between the proportion of Luxembourgers and unemploymnet rate among females in the United States with a correlation coefficient (R) of 0.613 and weighted average of 4.4%, a difference of 24.4%.
Female Unemployment Correlation Summary
| Measurement | Delaware | Luxembourger |
| Minimum | 0.50% | 0.50% |
| Maximum | 22.4% | 23.6% |
| Range | 21.9% | 23.1% |
| Mean | 5.8% | 4.4% |
| Median | 4.8% | 3.7% |
| Interquartile 25% (IQ1) | 3.3% | 1.8% |
| Interquartile 75% (IQ3) | 7.1% | 5.1% |
| Interquartile Range (IQR) | 3.8% | 3.2% |
| Standard Deviation (Sample) | 4.0% | 4.2% |
| Standard Deviation (Population) | 3.9% | 4.2% |
Similar Demographics by Female Unemployment
Demographics Similar to Delaware by Female Unemployment
In terms of female unemployment, the demographic groups most similar to Delaware are Nicaraguan (5.5%, a difference of 0.010%), Brazilian (5.5%, a difference of 0.030%), Iraqi (5.5%, a difference of 0.030%), French American Indian (5.5%, a difference of 0.25%), and Immigrants from Africa (5.4%, a difference of 0.27%).
| Demographics | Rating | Rank | Female Unemployment |
| Comanche | 10.0 /100 | #216 | Poor 5.4% |
| Peruvians | 9.6 /100 | #217 | Tragic 5.4% |
| Bermudans | 9.0 /100 | #218 | Tragic 5.4% |
| South Americans | 8.6 /100 | #219 | Tragic 5.4% |
| Immigrants | Africa | 8.5 /100 | #220 | Tragic 5.4% |
| Brazilians | 7.3 /100 | #221 | Tragic 5.5% |
| Nicaraguans | 7.2 /100 | #222 | Tragic 5.5% |
| Delaware | 7.2 /100 | #223 | Tragic 5.5% |
| Iraqis | 7.1 /100 | #224 | Tragic 5.5% |
| French American Indians | 6.1 /100 | #225 | Tragic 5.5% |
| Immigrants | Peru | 5.9 /100 | #226 | Tragic 5.5% |
| Immigrants | Philippines | 5.3 /100 | #227 | Tragic 5.5% |
| Israelis | 4.8 /100 | #228 | Tragic 5.5% |
| Panamanians | 4.7 /100 | #229 | Tragic 5.5% |
| Immigrants | Uruguay | 4.7 /100 | #230 | Tragic 5.5% |
Demographics Similar to Luxembourgers by Female Unemployment
In terms of female unemployment, the demographic groups most similar to Luxembourgers are Czech (4.4%, a difference of 0.010%), Danish (4.4%, a difference of 0.030%), Hmong (4.4%, a difference of 0.14%), Swedish (4.4%, a difference of 1.4%), and Chinese (4.5%, a difference of 2.2%).
| Demographics | Rating | Rank | Female Unemployment |
| Norwegians | 100.0 /100 | #1 | Exceptional 4.2% |
| Czechs | 100.0 /100 | #2 | Exceptional 4.4% |
| Luxembourgers | 100.0 /100 | #3 | Exceptional 4.4% |
| Danes | 100.0 /100 | #4 | Exceptional 4.4% |
| Hmong | 100.0 /100 | #5 | Exceptional 4.4% |
| Swedes | 100.0 /100 | #6 | Exceptional 4.4% |
| Chinese | 100.0 /100 | #7 | Exceptional 4.5% |
| Germans | 100.0 /100 | #8 | Exceptional 4.5% |
| Slovenes | 100.0 /100 | #9 | Exceptional 4.5% |
| Swiss | 100.0 /100 | #10 | Exceptional 4.6% |
| Scandinavians | 100.0 /100 | #11 | Exceptional 4.6% |
| Dutch | 100.0 /100 | #12 | Exceptional 4.6% |
| Belgians | 100.0 /100 | #13 | Exceptional 4.6% |
| Finns | 100.0 /100 | #14 | Exceptional 4.6% |
| English | 100.0 /100 | #15 | Exceptional 4.6% |