Delaware vs Alaskan Athabascan Unemployment Among Ages 65 to 74 years
COMPARE
Delaware
Alaskan Athabascan
Unemployment Among Ages 65 to 74 years
Unemployment Among Ages 65 to 74 years Comparison
Delaware
Alaskan Athabascans
6.0%
UNEMPLOYMENT AMONG AGES 65 TO 74 YEARS
0.0/ 100
METRIC RATING
323rd/ 347
METRIC RANK
7.4%
UNEMPLOYMENT AMONG AGES 65 TO 74 YEARS
0.0/ 100
METRIC RATING
343rd/ 347
METRIC RANK
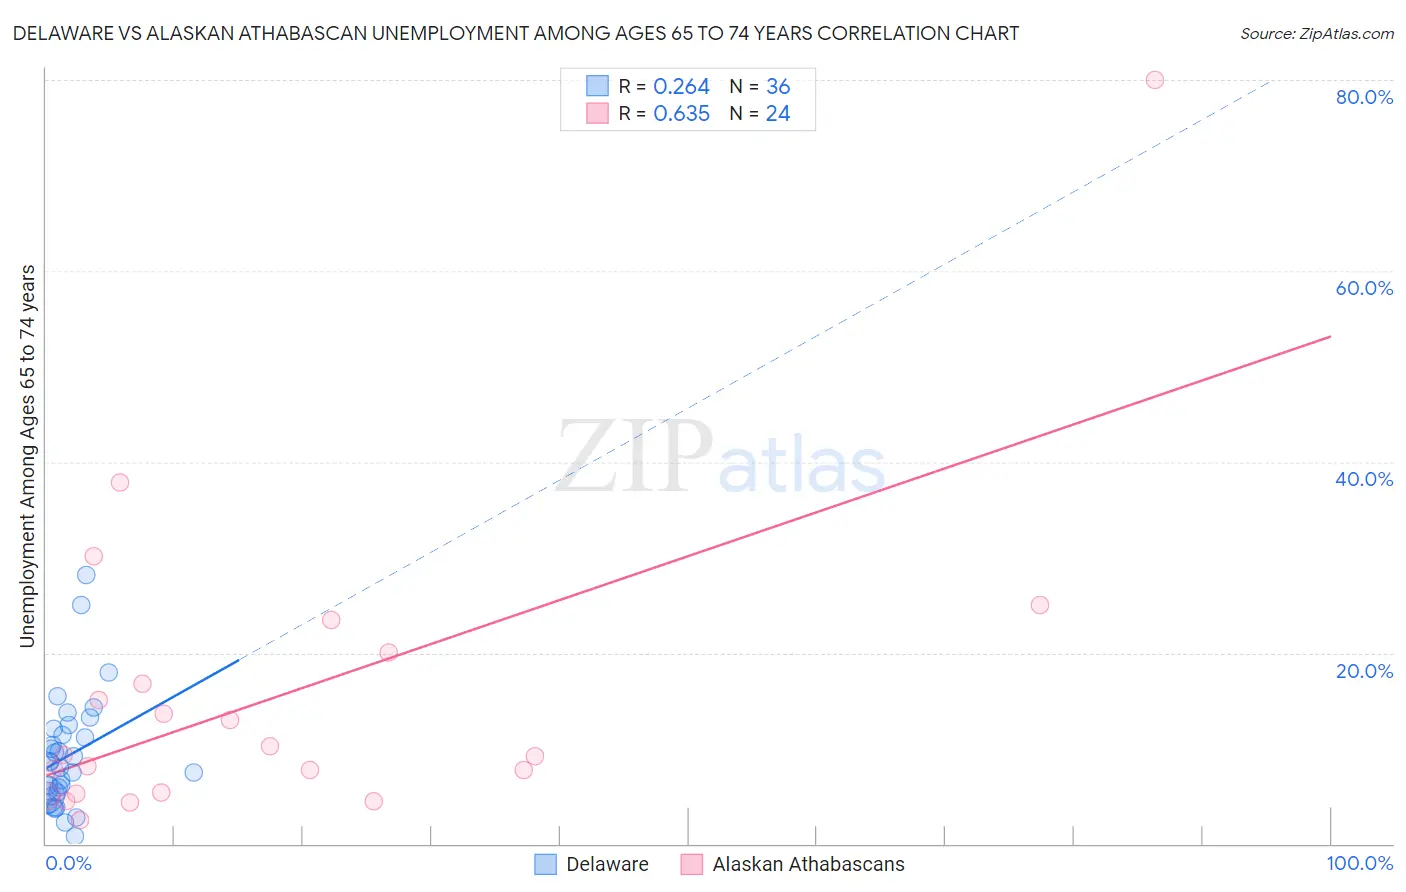
Delaware vs Alaskan Athabascan Unemployment Among Ages 65 to 74 years Correlation Chart
The statistical analysis conducted on geographies consisting of 90,004,894 people shows a weak positive correlation between the proportion of Delaware and unemployment rate among population between the ages 65 and 74 in the United States with a correlation coefficient (R) of 0.264 and weighted average of 6.0%. Similarly, the statistical analysis conducted on geographies consisting of 43,758,538 people shows a significant positive correlation between the proportion of Alaskan Athabascans and unemployment rate among population between the ages 65 and 74 in the United States with a correlation coefficient (R) of 0.635 and weighted average of 7.4%, a difference of 22.8%.
Unemployment Among Ages 65 to 74 years Correlation Summary
| Measurement | Delaware | Alaskan Athabascan |
| Minimum | 0.80% | 2.5% |
| Maximum | 28.2% | 80.0% |
| Range | 27.4% | 77.5% |
| Mean | 9.2% | 15.3% |
| Median | 8.3% | 9.2% |
| Interquartile 25% (IQ1) | 5.2% | 5.3% |
| Interquartile 75% (IQ3) | 11.7% | 18.4% |
| Interquartile Range (IQR) | 6.5% | 13.0% |
| Standard Deviation (Sample) | 5.9% | 16.5% |
| Standard Deviation (Population) | 5.8% | 16.1% |
Demographics Similar to Delaware and Alaskan Athabascans by Unemployment Among Ages 65 to 74 years
In terms of unemployment among ages 65 to 74 years, the demographic groups most similar to Delaware are Tohono O'odham (6.0%, a difference of 0.58%), Immigrants from Portugal (6.0%, a difference of 0.69%), Native/Alaskan (6.0%, a difference of 0.94%), Shoshone (6.2%, a difference of 3.8%), and Immigrants from the Azores (6.2%, a difference of 4.0%). Similarly, the demographic groups most similar to Alaskan Athabascans are Navajo (6.9%, a difference of 6.2%), Alaska Native (6.8%, a difference of 7.7%), Pima (6.6%, a difference of 11.2%), Yakama (6.6%, a difference of 12.1%), and Tlingit-Haida (6.5%, a difference of 12.5%).
| Demographics | Rating | Rank | Unemployment Among Ages 65 to 74 years |
| Delaware | 0.0 /100 | #323 | Tragic 6.0% |
| Tohono O'odham | 0.0 /100 | #324 | Tragic 6.0% |
| Immigrants | Portugal | 0.0 /100 | #325 | Tragic 6.0% |
| Natives/Alaskans | 0.0 /100 | #326 | Tragic 6.0% |
| Shoshone | 0.0 /100 | #327 | Tragic 6.2% |
| Immigrants | Azores | 0.0 /100 | #328 | Tragic 6.2% |
| Yuman | 0.0 /100 | #329 | Tragic 6.2% |
| Dominicans | 0.0 /100 | #330 | Tragic 6.3% |
| Bermudans | 0.0 /100 | #331 | Tragic 6.3% |
| Immigrants | Dominican Republic | 0.0 /100 | #332 | Tragic 6.3% |
| Paiute | 0.0 /100 | #333 | Tragic 6.3% |
| Taiwanese | 0.0 /100 | #334 | Tragic 6.3% |
| Puerto Ricans | 0.0 /100 | #335 | Tragic 6.4% |
| Immigrants | Armenia | 0.0 /100 | #336 | Tragic 6.5% |
| Ute | 0.0 /100 | #337 | Tragic 6.5% |
| Tlingit-Haida | 0.0 /100 | #338 | Tragic 6.5% |
| Yakama | 0.0 /100 | #339 | Tragic 6.6% |
| Pima | 0.0 /100 | #340 | Tragic 6.6% |
| Alaska Natives | 0.0 /100 | #341 | Tragic 6.8% |
| Navajo | 0.0 /100 | #342 | Tragic 6.9% |
| Alaskan Athabascans | 0.0 /100 | #343 | Tragic 7.4% |