Delaware vs Immigrants from Netherlands Unemployment Among Ages 65 to 74 years
COMPARE
Delaware
Immigrants from Netherlands
Unemployment Among Ages 65 to 74 years
Unemployment Among Ages 65 to 74 years Comparison
Delaware
Immigrants from Netherlands
6.0%
UNEMPLOYMENT AMONG AGES 65 TO 74 YEARS
0.0/ 100
METRIC RATING
323rd/ 347
METRIC RANK
5.2%
UNEMPLOYMENT AMONG AGES 65 TO 74 YEARS
97.1/ 100
METRIC RATING
93rd/ 347
METRIC RANK
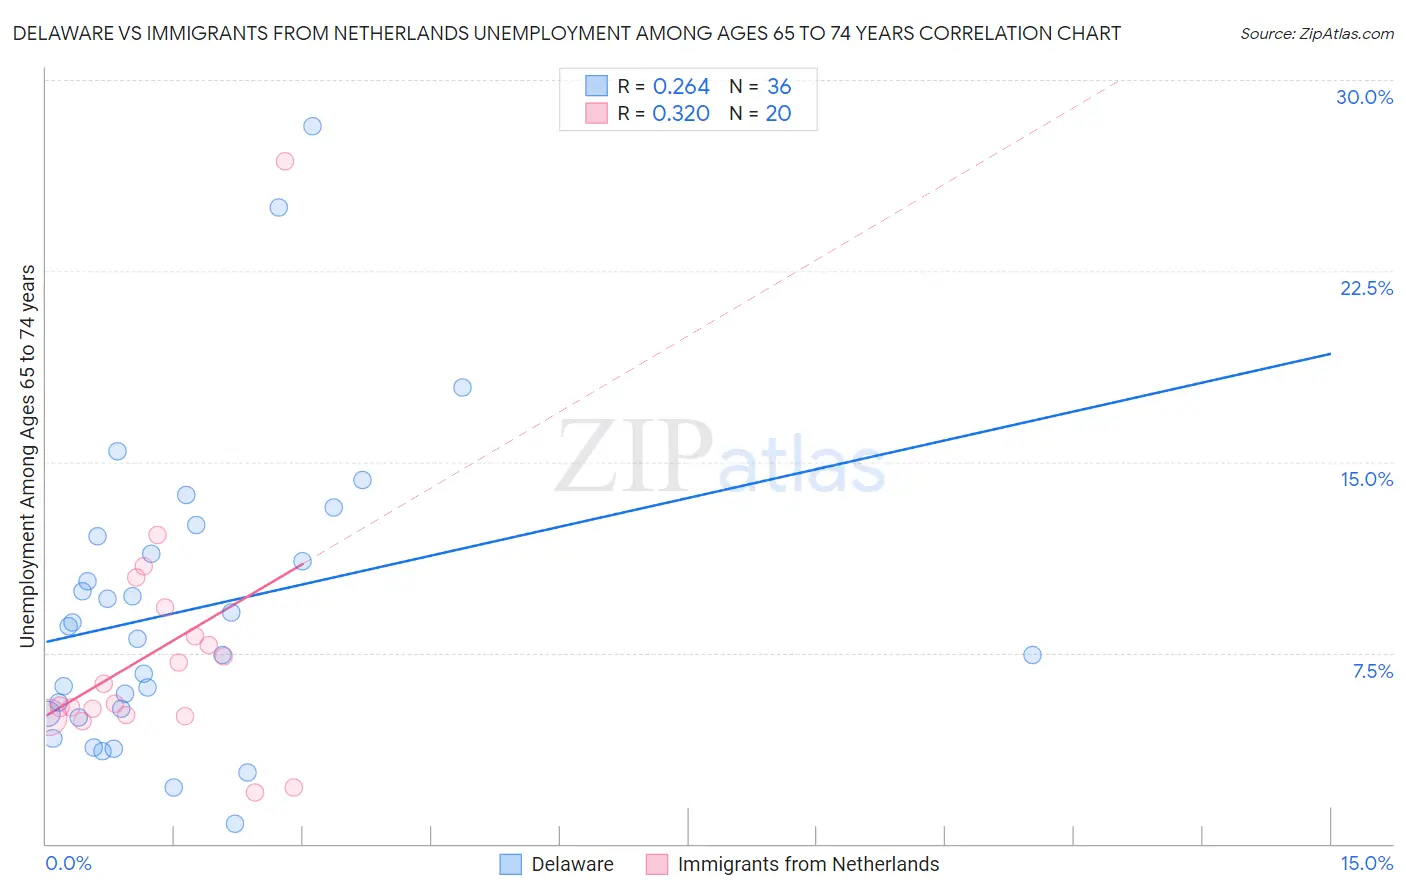
Delaware vs Immigrants from Netherlands Unemployment Among Ages 65 to 74 years Correlation Chart
The statistical analysis conducted on geographies consisting of 90,004,894 people shows a weak positive correlation between the proportion of Delaware and unemployment rate among population between the ages 65 and 74 in the United States with a correlation coefficient (R) of 0.264 and weighted average of 6.0%. Similarly, the statistical analysis conducted on geographies consisting of 219,144,669 people shows a mild positive correlation between the proportion of Immigrants from Netherlands and unemployment rate among population between the ages 65 and 74 in the United States with a correlation coefficient (R) of 0.320 and weighted average of 5.2%, a difference of 14.9%.
Unemployment Among Ages 65 to 74 years Correlation Summary
| Measurement | Delaware | Immigrants from Netherlands |
| Minimum | 0.80% | 2.0% |
| Maximum | 28.2% | 26.8% |
| Range | 27.4% | 24.8% |
| Mean | 9.2% | 7.6% |
| Median | 8.3% | 5.9% |
| Interquartile 25% (IQ1) | 5.2% | 5.0% |
| Interquartile 75% (IQ3) | 11.7% | 8.7% |
| Interquartile Range (IQR) | 6.5% | 3.7% |
| Standard Deviation (Sample) | 5.9% | 5.2% |
| Standard Deviation (Population) | 5.8% | 5.1% |
Similar Demographics by Unemployment Among Ages 65 to 74 years
Demographics Similar to Delaware by Unemployment Among Ages 65 to 74 years
In terms of unemployment among ages 65 to 74 years, the demographic groups most similar to Delaware are Immigrants from Mexico (6.0%, a difference of 0.060%), Immigrants from Dominica (6.0%, a difference of 0.28%), Tohono O'odham (6.0%, a difference of 0.58%), Immigrants from Bahamas (5.9%, a difference of 0.65%), and Immigrants from Portugal (6.0%, a difference of 0.69%).
| Demographics | Rating | Rank | Unemployment Among Ages 65 to 74 years |
| Immigrants | El Salvador | 0.0 /100 | #316 | Tragic 5.9% |
| Immigrants | Central America | 0.0 /100 | #317 | Tragic 5.9% |
| Zimbabweans | 0.0 /100 | #318 | Tragic 5.9% |
| Aleuts | 0.0 /100 | #319 | Tragic 5.9% |
| Immigrants | Bahamas | 0.0 /100 | #320 | Tragic 5.9% |
| Immigrants | Dominica | 0.0 /100 | #321 | Tragic 6.0% |
| Immigrants | Mexico | 0.0 /100 | #322 | Tragic 6.0% |
| Delaware | 0.0 /100 | #323 | Tragic 6.0% |
| Tohono O'odham | 0.0 /100 | #324 | Tragic 6.0% |
| Immigrants | Portugal | 0.0 /100 | #325 | Tragic 6.0% |
| Natives/Alaskans | 0.0 /100 | #326 | Tragic 6.0% |
| Shoshone | 0.0 /100 | #327 | Tragic 6.2% |
| Immigrants | Azores | 0.0 /100 | #328 | Tragic 6.2% |
| Yuman | 0.0 /100 | #329 | Tragic 6.2% |
| Dominicans | 0.0 /100 | #330 | Tragic 6.3% |
Demographics Similar to Immigrants from Netherlands by Unemployment Among Ages 65 to 74 years
In terms of unemployment among ages 65 to 74 years, the demographic groups most similar to Immigrants from Netherlands are South African (5.2%, a difference of 0.020%), Serbian (5.2%, a difference of 0.020%), Immigrants from Thailand (5.2%, a difference of 0.050%), Puget Sound Salish (5.2%, a difference of 0.060%), and Romanian (5.2%, a difference of 0.080%).
| Demographics | Rating | Rank | Unemployment Among Ages 65 to 74 years |
| Danes | 97.9 /100 | #86 | Exceptional 5.2% |
| Scottish | 97.9 /100 | #87 | Exceptional 5.2% |
| Immigrants | Saudi Arabia | 97.9 /100 | #88 | Exceptional 5.2% |
| English | 97.8 /100 | #89 | Exceptional 5.2% |
| Luxembourgers | 97.6 /100 | #90 | Exceptional 5.2% |
| Romanians | 97.4 /100 | #91 | Exceptional 5.2% |
| Puget Sound Salish | 97.3 /100 | #92 | Exceptional 5.2% |
| Immigrants | Netherlands | 97.1 /100 | #93 | Exceptional 5.2% |
| South Africans | 97.1 /100 | #94 | Exceptional 5.2% |
| Serbians | 97.0 /100 | #95 | Exceptional 5.2% |
| Immigrants | Thailand | 97.0 /100 | #96 | Exceptional 5.2% |
| Senegalese | 96.5 /100 | #97 | Exceptional 5.2% |
| Welsh | 96.5 /100 | #98 | Exceptional 5.2% |
| Burmese | 96.4 /100 | #99 | Exceptional 5.2% |
| Japanese | 96.4 /100 | #100 | Exceptional 5.2% |