Puerto Rican vs Alaskan Athabascan Unemployment Among Ages 65 to 74 years
COMPARE
Puerto Rican
Alaskan Athabascan
Unemployment Among Ages 65 to 74 years
Unemployment Among Ages 65 to 74 years Comparison
Puerto Ricans
Alaskan Athabascans
6.4%
UNEMPLOYMENT AMONG AGES 65 TO 74 YEARS
0.0/ 100
METRIC RATING
335th/ 347
METRIC RANK
7.4%
UNEMPLOYMENT AMONG AGES 65 TO 74 YEARS
0.0/ 100
METRIC RATING
343rd/ 347
METRIC RANK
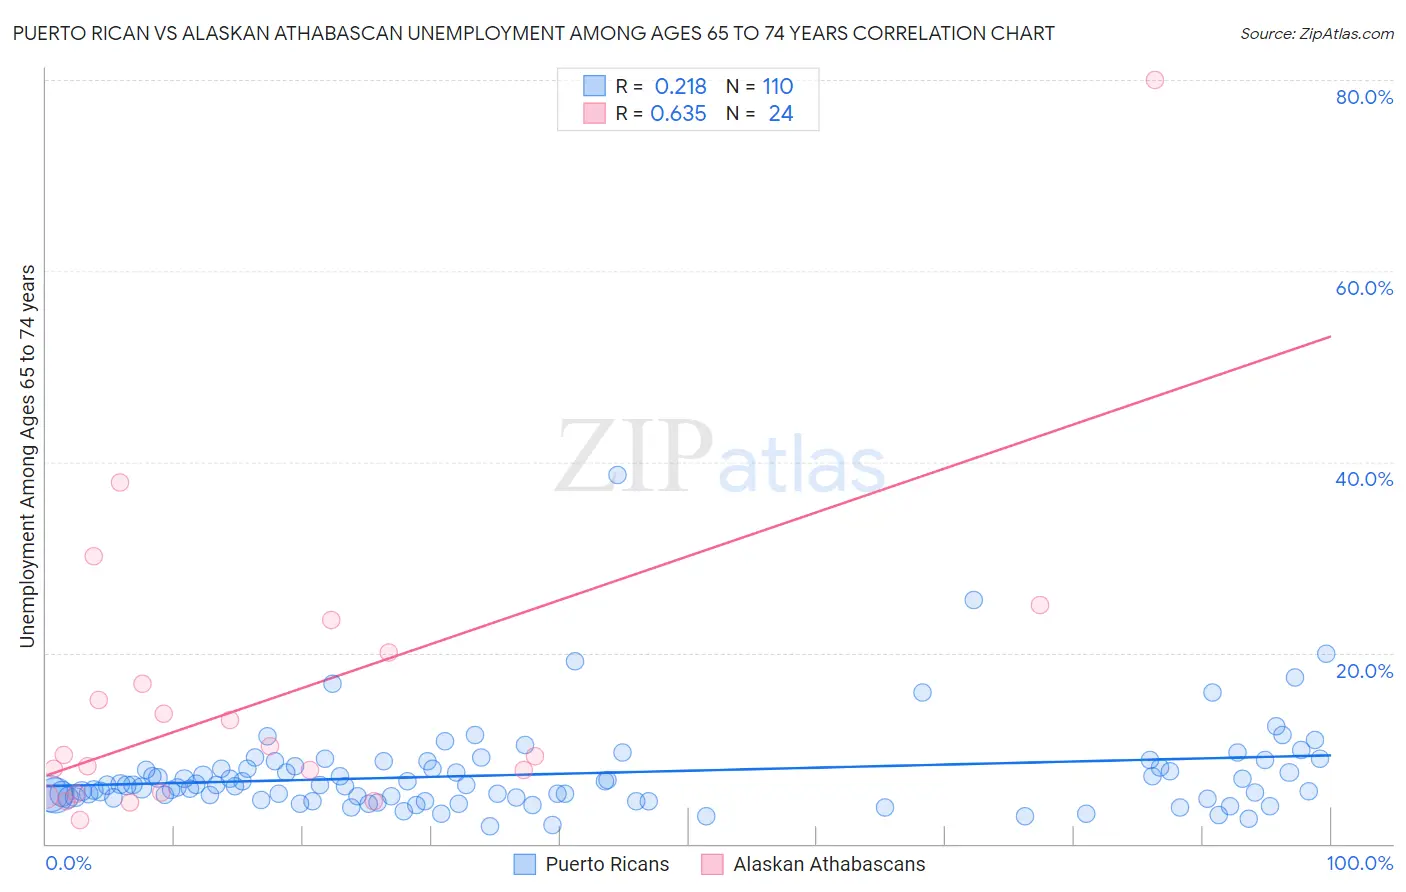
Puerto Rican vs Alaskan Athabascan Unemployment Among Ages 65 to 74 years Correlation Chart
The statistical analysis conducted on geographies consisting of 431,991,272 people shows a weak positive correlation between the proportion of Puerto Ricans and unemployment rate among population between the ages 65 and 74 in the United States with a correlation coefficient (R) of 0.218 and weighted average of 6.4%. Similarly, the statistical analysis conducted on geographies consisting of 43,758,538 people shows a significant positive correlation between the proportion of Alaskan Athabascans and unemployment rate among population between the ages 65 and 74 in the United States with a correlation coefficient (R) of 0.635 and weighted average of 7.4%, a difference of 15.3%.
Unemployment Among Ages 65 to 74 years Correlation Summary
| Measurement | Puerto Rican | Alaskan Athabascan |
| Minimum | 1.8% | 2.5% |
| Maximum | 38.6% | 80.0% |
| Range | 36.8% | 77.5% |
| Mean | 7.3% | 15.3% |
| Median | 6.1% | 9.2% |
| Interquartile 25% (IQ1) | 4.8% | 5.3% |
| Interquartile 75% (IQ3) | 8.1% | 18.4% |
| Interquartile Range (IQR) | 3.2% | 13.0% |
| Standard Deviation (Sample) | 4.9% | 16.5% |
| Standard Deviation (Population) | 4.8% | 16.1% |
Demographics Similar to Puerto Ricans and Alaskan Athabascans by Unemployment Among Ages 65 to 74 years
In terms of unemployment among ages 65 to 74 years, the demographic groups most similar to Puerto Ricans are Taiwanese (6.3%, a difference of 1.1%), Paiute (6.3%, a difference of 1.3%), Immigrants from Dominican Republic (6.3%, a difference of 1.3%), Immigrants from Armenia (6.5%, a difference of 1.6%), and Bermudan (6.3%, a difference of 1.7%). Similarly, the demographic groups most similar to Alaskan Athabascans are Inupiat (7.5%, a difference of 1.9%), Navajo (6.9%, a difference of 6.2%), Alaska Native (6.8%, a difference of 7.7%), Pima (6.6%, a difference of 11.2%), and Yakama (6.6%, a difference of 12.1%).
| Demographics | Rating | Rank | Unemployment Among Ages 65 to 74 years |
| Immigrants | Azores | 0.0 /100 | #328 | Tragic 6.2% |
| Yuman | 0.0 /100 | #329 | Tragic 6.2% |
| Dominicans | 0.0 /100 | #330 | Tragic 6.3% |
| Bermudans | 0.0 /100 | #331 | Tragic 6.3% |
| Immigrants | Dominican Republic | 0.0 /100 | #332 | Tragic 6.3% |
| Paiute | 0.0 /100 | #333 | Tragic 6.3% |
| Taiwanese | 0.0 /100 | #334 | Tragic 6.3% |
| Puerto Ricans | 0.0 /100 | #335 | Tragic 6.4% |
| Immigrants | Armenia | 0.0 /100 | #336 | Tragic 6.5% |
| Ute | 0.0 /100 | #337 | Tragic 6.5% |
| Tlingit-Haida | 0.0 /100 | #338 | Tragic 6.5% |
| Yakama | 0.0 /100 | #339 | Tragic 6.6% |
| Pima | 0.0 /100 | #340 | Tragic 6.6% |
| Alaska Natives | 0.0 /100 | #341 | Tragic 6.8% |
| Navajo | 0.0 /100 | #342 | Tragic 6.9% |
| Alaskan Athabascans | 0.0 /100 | #343 | Tragic 7.4% |
| Inupiat | 0.0 /100 | #344 | Tragic 7.5% |
| Immigrants | Yemen | 0.0 /100 | #345 | Tragic 8.3% |
| Yup'ik | 0.0 /100 | #346 | Tragic 9.5% |
| Crow | 0.0 /100 | #347 | Tragic 17.4% |