Delaware vs Immigrants from Belarus Unemployment Among Ages 65 to 74 years
COMPARE
Delaware
Immigrants from Belarus
Unemployment Among Ages 65 to 74 years
Unemployment Among Ages 65 to 74 years Comparison
Delaware
Immigrants from Belarus
6.0%
UNEMPLOYMENT AMONG AGES 65 TO 74 YEARS
0.0/ 100
METRIC RATING
323rd/ 347
METRIC RANK
5.3%
UNEMPLOYMENT AMONG AGES 65 TO 74 YEARS
90.1/ 100
METRIC RATING
118th/ 347
METRIC RANK
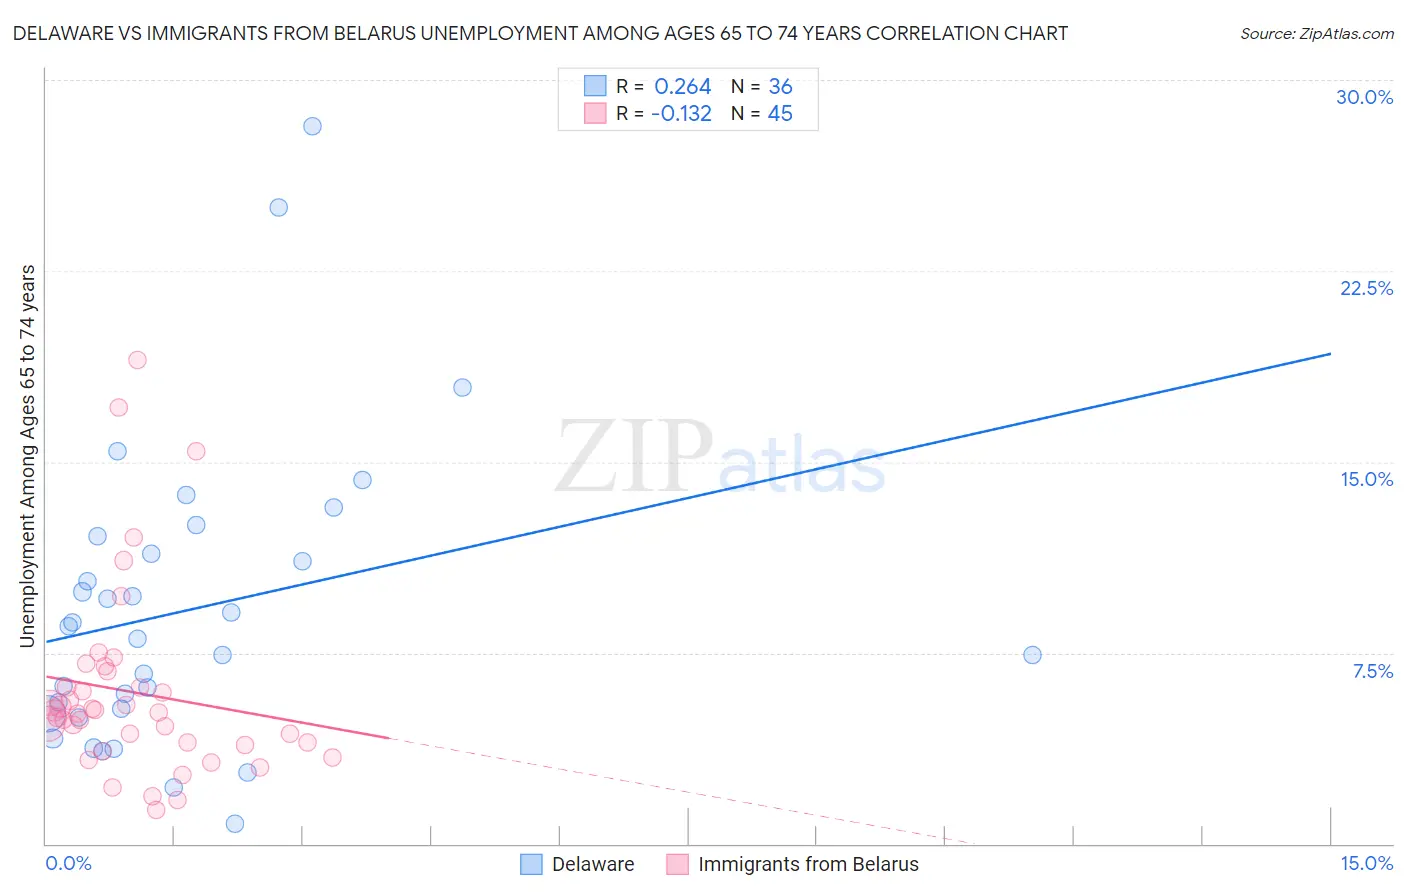
Delaware vs Immigrants from Belarus Unemployment Among Ages 65 to 74 years Correlation Chart
The statistical analysis conducted on geographies consisting of 90,004,894 people shows a weak positive correlation between the proportion of Delaware and unemployment rate among population between the ages 65 and 74 in the United States with a correlation coefficient (R) of 0.264 and weighted average of 6.0%. Similarly, the statistical analysis conducted on geographies consisting of 143,080,232 people shows a poor negative correlation between the proportion of Immigrants from Belarus and unemployment rate among population between the ages 65 and 74 in the United States with a correlation coefficient (R) of -0.132 and weighted average of 5.3%, a difference of 13.6%.
Unemployment Among Ages 65 to 74 years Correlation Summary
| Measurement | Delaware | Immigrants from Belarus |
| Minimum | 0.80% | 1.3% |
| Maximum | 28.2% | 19.0% |
| Range | 27.4% | 17.6% |
| Mean | 9.2% | 6.0% |
| Median | 8.3% | 5.1% |
| Interquartile 25% (IQ1) | 5.2% | 4.0% |
| Interquartile 75% (IQ3) | 11.7% | 6.4% |
| Interquartile Range (IQR) | 6.5% | 2.5% |
| Standard Deviation (Sample) | 5.9% | 3.7% |
| Standard Deviation (Population) | 5.8% | 3.7% |
Similar Demographics by Unemployment Among Ages 65 to 74 years
Demographics Similar to Delaware by Unemployment Among Ages 65 to 74 years
In terms of unemployment among ages 65 to 74 years, the demographic groups most similar to Delaware are Immigrants from Mexico (6.0%, a difference of 0.060%), Immigrants from Dominica (6.0%, a difference of 0.28%), Tohono O'odham (6.0%, a difference of 0.58%), Immigrants from Bahamas (5.9%, a difference of 0.65%), and Immigrants from Portugal (6.0%, a difference of 0.69%).
| Demographics | Rating | Rank | Unemployment Among Ages 65 to 74 years |
| Immigrants | El Salvador | 0.0 /100 | #316 | Tragic 5.9% |
| Immigrants | Central America | 0.0 /100 | #317 | Tragic 5.9% |
| Zimbabweans | 0.0 /100 | #318 | Tragic 5.9% |
| Aleuts | 0.0 /100 | #319 | Tragic 5.9% |
| Immigrants | Bahamas | 0.0 /100 | #320 | Tragic 5.9% |
| Immigrants | Dominica | 0.0 /100 | #321 | Tragic 6.0% |
| Immigrants | Mexico | 0.0 /100 | #322 | Tragic 6.0% |
| Delaware | 0.0 /100 | #323 | Tragic 6.0% |
| Tohono O'odham | 0.0 /100 | #324 | Tragic 6.0% |
| Immigrants | Portugal | 0.0 /100 | #325 | Tragic 6.0% |
| Natives/Alaskans | 0.0 /100 | #326 | Tragic 6.0% |
| Shoshone | 0.0 /100 | #327 | Tragic 6.2% |
| Immigrants | Azores | 0.0 /100 | #328 | Tragic 6.2% |
| Yuman | 0.0 /100 | #329 | Tragic 6.2% |
| Dominicans | 0.0 /100 | #330 | Tragic 6.3% |
Demographics Similar to Immigrants from Belarus by Unemployment Among Ages 65 to 74 years
In terms of unemployment among ages 65 to 74 years, the demographic groups most similar to Immigrants from Belarus are Immigrants from Korea (5.3%, a difference of 0.010%), Immigrants from Fiji (5.3%, a difference of 0.010%), Immigrants from Switzerland (5.3%, a difference of 0.020%), Australian (5.3%, a difference of 0.030%), and Immigrants from Turkey (5.3%, a difference of 0.070%).
| Demographics | Rating | Rank | Unemployment Among Ages 65 to 74 years |
| Sri Lankans | 92.7 /100 | #111 | Exceptional 5.3% |
| Immigrants | South Central Asia | 92.4 /100 | #112 | Exceptional 5.3% |
| Immigrants | Germany | 91.6 /100 | #113 | Exceptional 5.3% |
| Asians | 91.1 /100 | #114 | Exceptional 5.3% |
| Immigrants | Turkey | 90.8 /100 | #115 | Exceptional 5.3% |
| Australians | 90.4 /100 | #116 | Exceptional 5.3% |
| Immigrants | Korea | 90.2 /100 | #117 | Exceptional 5.3% |
| Immigrants | Belarus | 90.1 /100 | #118 | Exceptional 5.3% |
| Immigrants | Fiji | 89.9 /100 | #119 | Excellent 5.3% |
| Immigrants | Switzerland | 89.9 /100 | #120 | Excellent 5.3% |
| Immigrants | Australia | 89.1 /100 | #121 | Excellent 5.3% |
| Immigrants | Canada | 89.0 /100 | #122 | Excellent 5.3% |
| Czechoslovakians | 88.6 /100 | #123 | Excellent 5.3% |
| Immigrants | Ukraine | 87.5 /100 | #124 | Excellent 5.3% |
| Pakistanis | 87.5 /100 | #125 | Excellent 5.3% |