Tlingit-Haida vs Alaskan Athabascan Unemployment Among Ages 65 to 74 years
COMPARE
Tlingit-Haida
Alaskan Athabascan
Unemployment Among Ages 65 to 74 years
Unemployment Among Ages 65 to 74 years Comparison
Tlingit-Haida
Alaskan Athabascans
6.5%
UNEMPLOYMENT AMONG AGES 65 TO 74 YEARS
0.0/ 100
METRIC RATING
338th/ 347
METRIC RANK
7.4%
UNEMPLOYMENT AMONG AGES 65 TO 74 YEARS
0.0/ 100
METRIC RATING
343rd/ 347
METRIC RANK
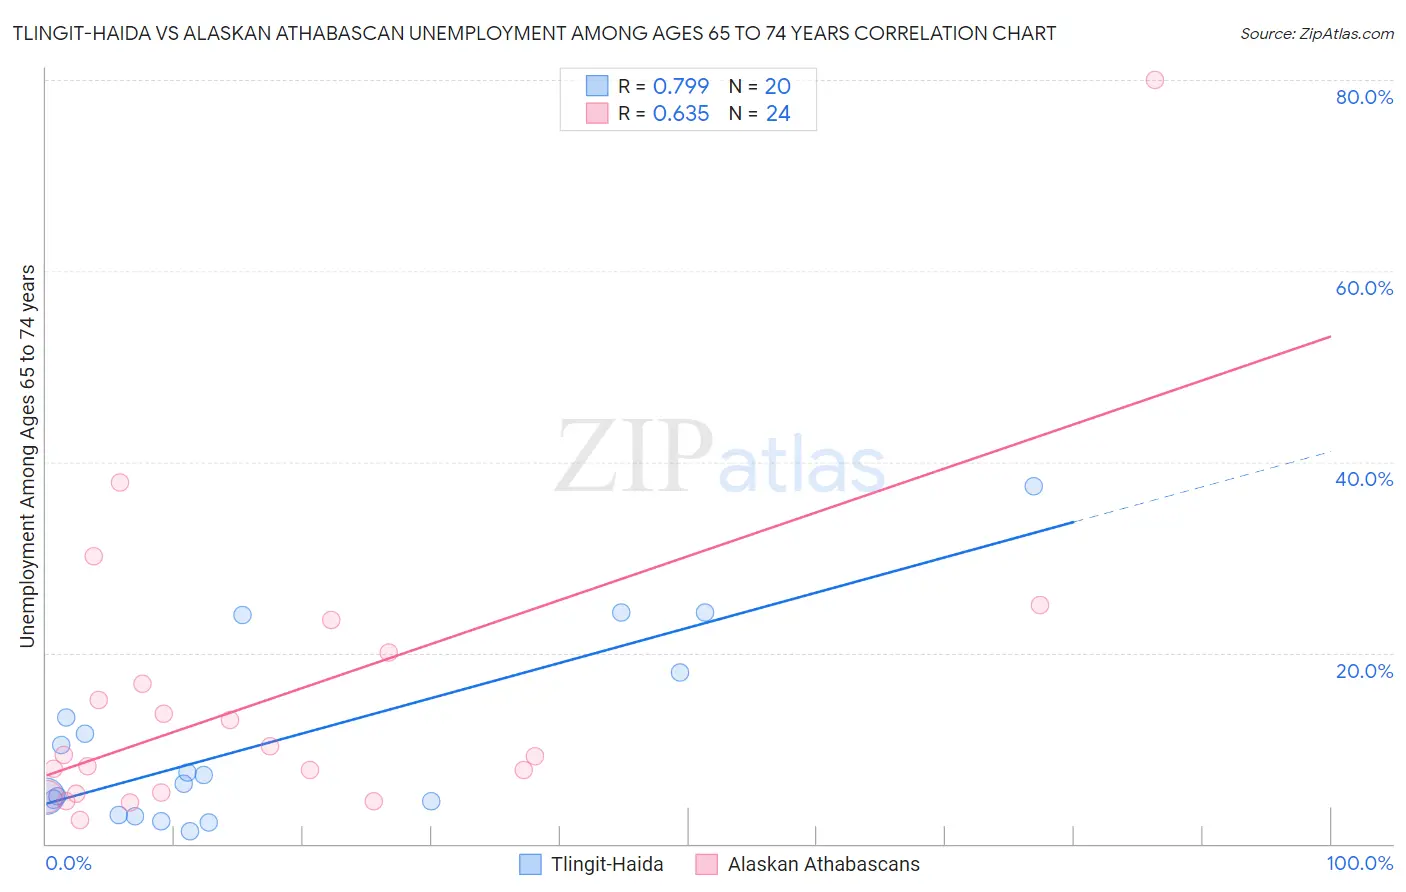
Tlingit-Haida vs Alaskan Athabascan Unemployment Among Ages 65 to 74 years Correlation Chart
The statistical analysis conducted on geographies consisting of 57,234,908 people shows a strong positive correlation between the proportion of Tlingit-Haida and unemployment rate among population between the ages 65 and 74 in the United States with a correlation coefficient (R) of 0.799 and weighted average of 6.5%. Similarly, the statistical analysis conducted on geographies consisting of 43,758,538 people shows a significant positive correlation between the proportion of Alaskan Athabascans and unemployment rate among population between the ages 65 and 74 in the United States with a correlation coefficient (R) of 0.635 and weighted average of 7.4%, a difference of 12.5%.
Unemployment Among Ages 65 to 74 years Correlation Summary
| Measurement | Tlingit-Haida | Alaskan Athabascan |
| Minimum | 1.3% | 2.5% |
| Maximum | 37.5% | 80.0% |
| Range | 36.2% | 77.5% |
| Mean | 10.7% | 15.3% |
| Median | 6.8% | 9.2% |
| Interquartile 25% (IQ1) | 3.7% | 5.3% |
| Interquartile 75% (IQ3) | 15.5% | 18.4% |
| Interquartile Range (IQR) | 11.8% | 13.0% |
| Standard Deviation (Sample) | 9.9% | 16.5% |
| Standard Deviation (Population) | 9.6% | 16.1% |
Demographics Similar to Tlingit-Haida and Alaskan Athabascans by Unemployment Among Ages 65 to 74 years
In terms of unemployment among ages 65 to 74 years, the demographic groups most similar to Tlingit-Haida are Ute (6.5%, a difference of 0.10%), Yakama (6.6%, a difference of 0.36%), Immigrants from Armenia (6.5%, a difference of 0.85%), Pima (6.6%, a difference of 1.2%), and Puerto Rican (6.4%, a difference of 2.5%). Similarly, the demographic groups most similar to Alaskan Athabascans are Inupiat (7.5%, a difference of 1.9%), Navajo (6.9%, a difference of 6.2%), Alaska Native (6.8%, a difference of 7.7%), Pima (6.6%, a difference of 11.2%), and Yakama (6.6%, a difference of 12.1%).
| Demographics | Rating | Rank | Unemployment Among Ages 65 to 74 years |
| Immigrants | Azores | 0.0 /100 | #328 | Tragic 6.2% |
| Yuman | 0.0 /100 | #329 | Tragic 6.2% |
| Dominicans | 0.0 /100 | #330 | Tragic 6.3% |
| Bermudans | 0.0 /100 | #331 | Tragic 6.3% |
| Immigrants | Dominican Republic | 0.0 /100 | #332 | Tragic 6.3% |
| Paiute | 0.0 /100 | #333 | Tragic 6.3% |
| Taiwanese | 0.0 /100 | #334 | Tragic 6.3% |
| Puerto Ricans | 0.0 /100 | #335 | Tragic 6.4% |
| Immigrants | Armenia | 0.0 /100 | #336 | Tragic 6.5% |
| Ute | 0.0 /100 | #337 | Tragic 6.5% |
| Tlingit-Haida | 0.0 /100 | #338 | Tragic 6.5% |
| Yakama | 0.0 /100 | #339 | Tragic 6.6% |
| Pima | 0.0 /100 | #340 | Tragic 6.6% |
| Alaska Natives | 0.0 /100 | #341 | Tragic 6.8% |
| Navajo | 0.0 /100 | #342 | Tragic 6.9% |
| Alaskan Athabascans | 0.0 /100 | #343 | Tragic 7.4% |
| Inupiat | 0.0 /100 | #344 | Tragic 7.5% |
| Immigrants | Yemen | 0.0 /100 | #345 | Tragic 8.3% |
| Yup'ik | 0.0 /100 | #346 | Tragic 9.5% |
| Crow | 0.0 /100 | #347 | Tragic 17.4% |