Greek vs Bhutanese Unemployment Among Ages 25 to 29 years
COMPARE
Greek
Bhutanese
Unemployment Among Ages 25 to 29 years
Unemployment Among Ages 25 to 29 years Comparison
Greeks
Bhutanese
6.6%
UNEMPLOYMENT AMONG AGES 25 TO 29 YEARS
58.5/ 100
METRIC RATING
164th/ 347
METRIC RANK
6.2%
UNEMPLOYMENT AMONG AGES 25 TO 29 YEARS
98.2/ 100
METRIC RATING
61st/ 347
METRIC RANK
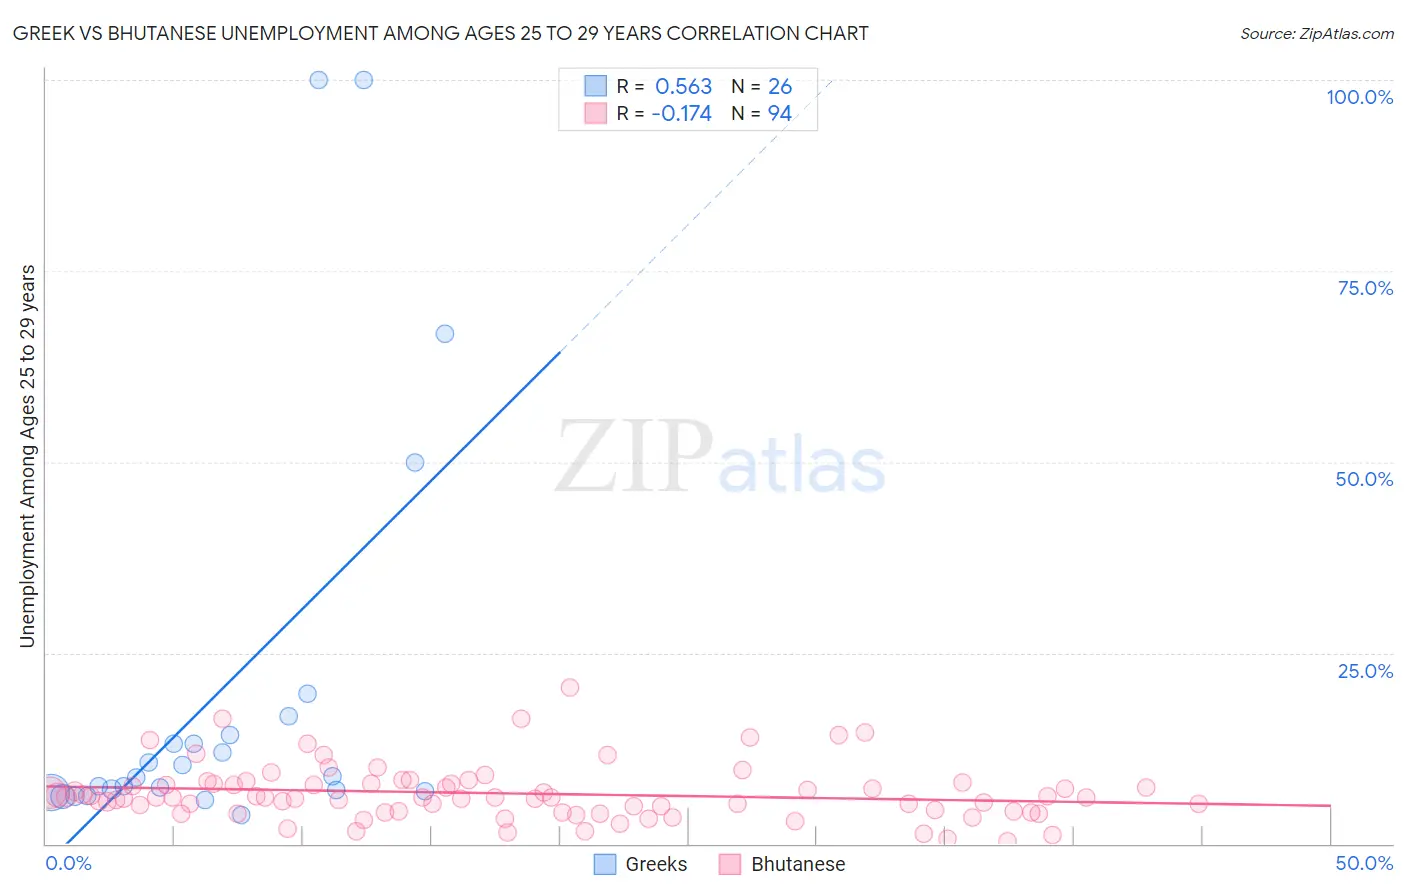
Greek vs Bhutanese Unemployment Among Ages 25 to 29 years Correlation Chart
The statistical analysis conducted on geographies consisting of 447,364,471 people shows a substantial positive correlation between the proportion of Greeks and unemployment rate among population between the ages 25 and 29 in the United States with a correlation coefficient (R) of 0.563 and weighted average of 6.6%. Similarly, the statistical analysis conducted on geographies consisting of 428,111,188 people shows a poor negative correlation between the proportion of Bhutanese and unemployment rate among population between the ages 25 and 29 in the United States with a correlation coefficient (R) of -0.174 and weighted average of 6.2%, a difference of 6.0%.
Unemployment Among Ages 25 to 29 years Correlation Summary
| Measurement | Greek | Bhutanese |
| Minimum | 3.8% | 0.40% |
| Maximum | 100.0% | 20.5% |
| Range | 96.2% | 20.1% |
| Mean | 20.1% | 6.6% |
| Median | 8.7% | 6.0% |
| Interquartile 25% (IQ1) | 6.8% | 4.2% |
| Interquartile 75% (IQ3) | 14.2% | 7.9% |
| Interquartile Range (IQR) | 7.4% | 3.7% |
| Standard Deviation (Sample) | 27.4% | 3.6% |
| Standard Deviation (Population) | 26.8% | 3.6% |
Similar Demographics by Unemployment Among Ages 25 to 29 years
Demographics Similar to Greeks by Unemployment Among Ages 25 to 29 years
In terms of unemployment among ages 25 to 29 years, the demographic groups most similar to Greeks are English (6.6%, a difference of 0.030%), Immigrants from Middle Africa (6.6%, a difference of 0.060%), Immigrants from Northern Europe (6.6%, a difference of 0.070%), Immigrants from Czechoslovakia (6.6%, a difference of 0.11%), and Paraguayan (6.6%, a difference of 0.12%).
| Demographics | Rating | Rank | Unemployment Among Ages 25 to 29 years |
| South Africans | 63.5 /100 | #157 | Good 6.6% |
| Immigrants | Russia | 61.5 /100 | #158 | Good 6.6% |
| Welsh | 61.3 /100 | #159 | Good 6.6% |
| Scottish | 60.7 /100 | #160 | Good 6.6% |
| Paraguayans | 60.4 /100 | #161 | Good 6.6% |
| Immigrants | Czechoslovakia | 60.2 /100 | #162 | Good 6.6% |
| Immigrants | Middle Africa | 59.4 /100 | #163 | Average 6.6% |
| Greeks | 58.5 /100 | #164 | Average 6.6% |
| English | 58.0 /100 | #165 | Average 6.6% |
| Immigrants | Northern Europe | 57.3 /100 | #166 | Average 6.6% |
| Immigrants | Canada | 55.0 /100 | #167 | Average 6.6% |
| Estonians | 54.8 /100 | #168 | Average 6.6% |
| South Americans | 54.5 /100 | #169 | Average 6.6% |
| Albanians | 53.5 /100 | #170 | Average 6.6% |
| Immigrants | Cambodia | 52.6 /100 | #171 | Average 6.6% |
Demographics Similar to Bhutanese by Unemployment Among Ages 25 to 29 years
In terms of unemployment among ages 25 to 29 years, the demographic groups most similar to Bhutanese are Immigrants from China (6.2%, a difference of 0.10%), Immigrants from Taiwan (6.2%, a difference of 0.12%), Luxembourger (6.2%, a difference of 0.15%), Kenyan (6.3%, a difference of 0.17%), and Immigrants from Sri Lanka (6.3%, a difference of 0.22%).
| Demographics | Rating | Rank | Unemployment Among Ages 25 to 29 years |
| Swedes | 98.8 /100 | #54 | Exceptional 6.2% |
| Immigrants | Netherlands | 98.7 /100 | #55 | Exceptional 6.2% |
| Immigrants | Burma/Myanmar | 98.7 /100 | #56 | Exceptional 6.2% |
| Immigrants | Saudi Arabia | 98.6 /100 | #57 | Exceptional 6.2% |
| Immigrants | Eastern Asia | 98.4 /100 | #58 | Exceptional 6.2% |
| Luxembourgers | 98.3 /100 | #59 | Exceptional 6.2% |
| Immigrants | Taiwan | 98.3 /100 | #60 | Exceptional 6.2% |
| Bhutanese | 98.2 /100 | #61 | Exceptional 6.2% |
| Immigrants | China | 98.1 /100 | #62 | Exceptional 6.2% |
| Kenyans | 98.0 /100 | #63 | Exceptional 6.3% |
| Immigrants | Sri Lanka | 97.9 /100 | #64 | Exceptional 6.3% |
| Immigrants | Lebanon | 97.8 /100 | #65 | Exceptional 6.3% |
| Indians (Asian) | 97.8 /100 | #66 | Exceptional 6.3% |
| Immigrants | Northern Africa | 97.8 /100 | #67 | Exceptional 6.3% |
| Palestinians | 97.7 /100 | #68 | Exceptional 6.3% |