Yuman vs Bhutanese Unemployment Among Ages 25 to 29 years
COMPARE
Yuman
Bhutanese
Unemployment Among Ages 25 to 29 years
Unemployment Among Ages 25 to 29 years Comparison
Yuman
Bhutanese
11.0%
UNEMPLOYMENT AMONG AGES 25 TO 29 YEARS
0.0/ 100
METRIC RATING
334th/ 347
METRIC RANK
6.2%
UNEMPLOYMENT AMONG AGES 25 TO 29 YEARS
98.2/ 100
METRIC RATING
61st/ 347
METRIC RANK
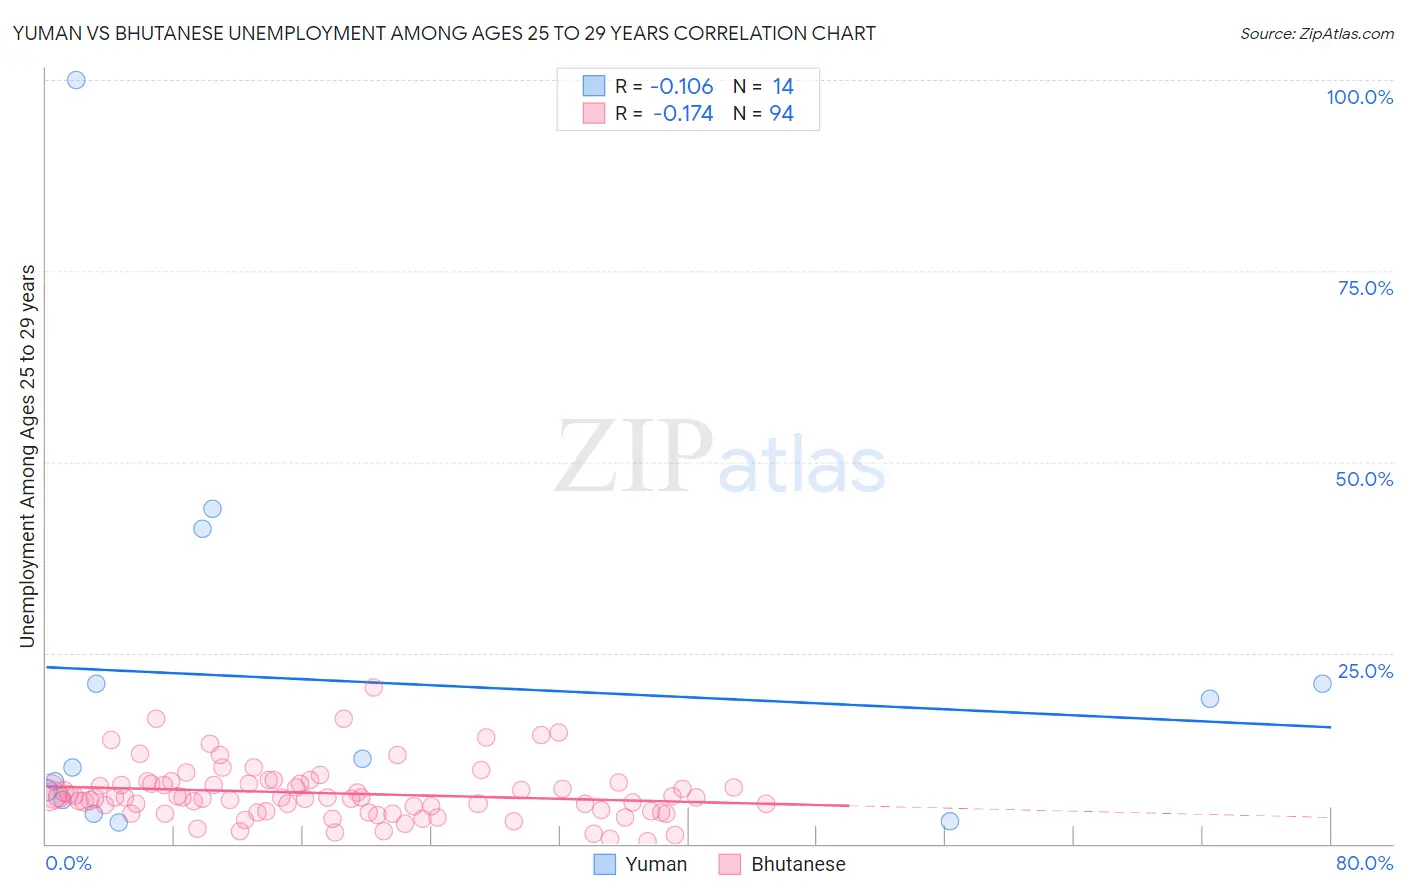
Yuman vs Bhutanese Unemployment Among Ages 25 to 29 years Correlation Chart
The statistical analysis conducted on geographies consisting of 40,399,570 people shows a poor negative correlation between the proportion of Yuman and unemployment rate among population between the ages 25 and 29 in the United States with a correlation coefficient (R) of -0.106 and weighted average of 11.0%. Similarly, the statistical analysis conducted on geographies consisting of 428,111,188 people shows a poor negative correlation between the proportion of Bhutanese and unemployment rate among population between the ages 25 and 29 in the United States with a correlation coefficient (R) of -0.174 and weighted average of 6.2%, a difference of 76.3%.
Unemployment Among Ages 25 to 29 years Correlation Summary
| Measurement | Yuman | Bhutanese |
| Minimum | 2.8% | 0.40% |
| Maximum | 100.0% | 20.5% |
| Range | 97.2% | 20.1% |
| Mean | 21.3% | 6.6% |
| Median | 10.5% | 6.0% |
| Interquartile 25% (IQ1) | 5.8% | 4.2% |
| Interquartile 75% (IQ3) | 21.0% | 7.9% |
| Interquartile Range (IQR) | 15.2% | 3.7% |
| Standard Deviation (Sample) | 26.2% | 3.6% |
| Standard Deviation (Population) | 25.3% | 3.6% |
Similar Demographics by Unemployment Among Ages 25 to 29 years
Demographics Similar to Yuman by Unemployment Among Ages 25 to 29 years
In terms of unemployment among ages 25 to 29 years, the demographic groups most similar to Yuman are Puerto Rican (11.1%, a difference of 1.1%), Alaskan Athabascan (10.8%, a difference of 2.0%), Lumbee (11.2%, a difference of 2.2%), Menominee (11.3%, a difference of 2.5%), and Pueblo (10.4%, a difference of 5.4%).
| Demographics | Rating | Rank | Unemployment Among Ages 25 to 29 years |
| Colville | 0.0 /100 | #327 | Tragic 9.2% |
| Apache | 0.0 /100 | #328 | Tragic 9.5% |
| Aleuts | 0.0 /100 | #329 | Tragic 9.7% |
| Natives/Alaskans | 0.0 /100 | #330 | Tragic 9.8% |
| Alaska Natives | 0.0 /100 | #331 | Tragic 10.2% |
| Pueblo | 0.0 /100 | #332 | Tragic 10.4% |
| Alaskan Athabascans | 0.0 /100 | #333 | Tragic 10.8% |
| Yuman | 0.0 /100 | #334 | Tragic 11.0% |
| Puerto Ricans | 0.0 /100 | #335 | Tragic 11.1% |
| Lumbee | 0.0 /100 | #336 | Tragic 11.2% |
| Menominee | 0.0 /100 | #337 | Tragic 11.3% |
| Sioux | 0.0 /100 | #338 | Tragic 11.7% |
| Pima | 0.0 /100 | #339 | Tragic 11.8% |
| Cheyenne | 0.0 /100 | #340 | Tragic 11.8% |
| Tohono O'odham | 0.0 /100 | #341 | Tragic 12.1% |
Demographics Similar to Bhutanese by Unemployment Among Ages 25 to 29 years
In terms of unemployment among ages 25 to 29 years, the demographic groups most similar to Bhutanese are Immigrants from China (6.2%, a difference of 0.10%), Immigrants from Taiwan (6.2%, a difference of 0.12%), Luxembourger (6.2%, a difference of 0.15%), Kenyan (6.3%, a difference of 0.17%), and Immigrants from Sri Lanka (6.3%, a difference of 0.22%).
| Demographics | Rating | Rank | Unemployment Among Ages 25 to 29 years |
| Swedes | 98.8 /100 | #54 | Exceptional 6.2% |
| Immigrants | Netherlands | 98.7 /100 | #55 | Exceptional 6.2% |
| Immigrants | Burma/Myanmar | 98.7 /100 | #56 | Exceptional 6.2% |
| Immigrants | Saudi Arabia | 98.6 /100 | #57 | Exceptional 6.2% |
| Immigrants | Eastern Asia | 98.4 /100 | #58 | Exceptional 6.2% |
| Luxembourgers | 98.3 /100 | #59 | Exceptional 6.2% |
| Immigrants | Taiwan | 98.3 /100 | #60 | Exceptional 6.2% |
| Bhutanese | 98.2 /100 | #61 | Exceptional 6.2% |
| Immigrants | China | 98.1 /100 | #62 | Exceptional 6.2% |
| Kenyans | 98.0 /100 | #63 | Exceptional 6.3% |
| Immigrants | Sri Lanka | 97.9 /100 | #64 | Exceptional 6.3% |
| Immigrants | Lebanon | 97.8 /100 | #65 | Exceptional 6.3% |
| Indians (Asian) | 97.8 /100 | #66 | Exceptional 6.3% |
| Immigrants | Northern Africa | 97.8 /100 | #67 | Exceptional 6.3% |
| Palestinians | 97.7 /100 | #68 | Exceptional 6.3% |