Cypriot vs Afghan Unemployment
COMPARE
Cypriot
Afghan
Unemployment
Unemployment Comparison
Cypriots
Afghans
4.9%
UNEMPLOYMENT
97.9/ 100
METRIC RATING
77th/ 347
METRIC RANK
5.3%
UNEMPLOYMENT
47.4/ 100
METRIC RATING
178th/ 347
METRIC RANK
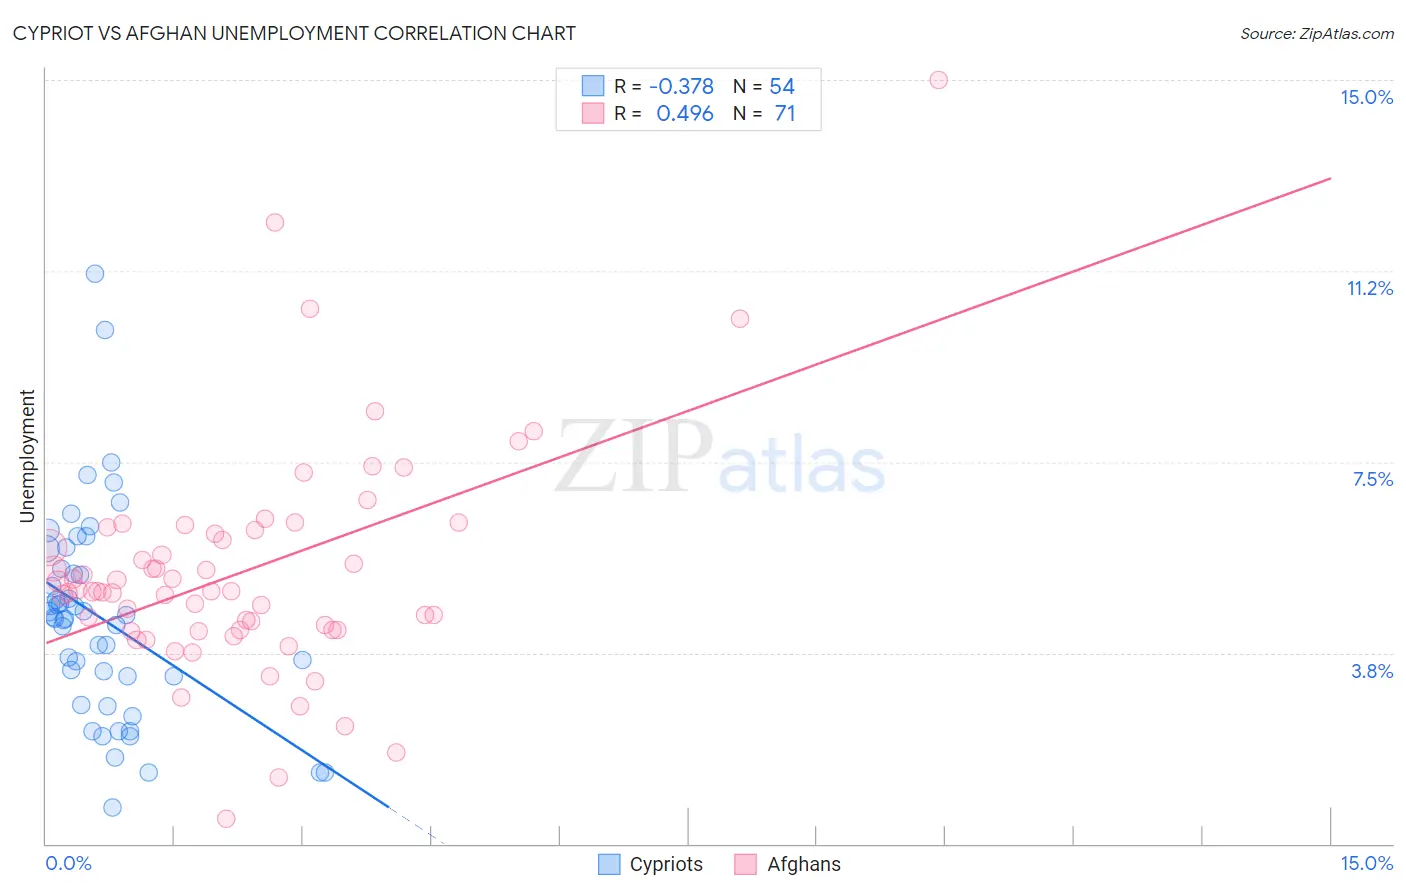
Cypriot vs Afghan Unemployment Correlation Chart
The statistical analysis conducted on geographies consisting of 61,864,376 people shows a mild negative correlation between the proportion of Cypriots and unemployment in the United States with a correlation coefficient (R) of -0.378 and weighted average of 4.9%. Similarly, the statistical analysis conducted on geographies consisting of 148,850,223 people shows a moderate positive correlation between the proportion of Afghans and unemployment in the United States with a correlation coefficient (R) of 0.496 and weighted average of 5.3%, a difference of 6.5%.
Unemployment Correlation Summary
| Measurement | Cypriot | Afghan |
| Minimum | 0.70% | 0.50% |
| Maximum | 11.2% | 15.0% |
| Range | 10.5% | 14.5% |
| Mean | 4.4% | 5.3% |
| Median | 4.4% | 5.0% |
| Interquartile 25% (IQ1) | 3.3% | 4.2% |
| Interquartile 75% (IQ3) | 5.4% | 6.2% |
| Interquartile Range (IQR) | 2.1% | 2.0% |
| Standard Deviation (Sample) | 2.0% | 2.2% |
| Standard Deviation (Population) | 2.0% | 2.2% |
Similar Demographics by Unemployment
Demographics Similar to Cypriots by Unemployment
In terms of unemployment, the demographic groups most similar to Cypriots are Okinawan (4.9%, a difference of 0.040%), German Russian (4.9%, a difference of 0.060%), Turkish (4.9%, a difference of 0.080%), Canadian (5.0%, a difference of 0.16%), and Immigrants from Northern Europe (4.9%, a difference of 0.22%).
| Demographics | Rating | Rank | Unemployment |
| Serbians | 98.4 /100 | #70 | Exceptional 4.9% |
| Immigrants | Japan | 98.3 /100 | #71 | Exceptional 4.9% |
| Burmese | 98.3 /100 | #72 | Exceptional 4.9% |
| Paraguayans | 98.3 /100 | #73 | Exceptional 4.9% |
| Immigrants | Northern Europe | 98.2 /100 | #74 | Exceptional 4.9% |
| Turks | 98.0 /100 | #75 | Exceptional 4.9% |
| German Russians | 98.0 /100 | #76 | Exceptional 4.9% |
| Cypriots | 97.9 /100 | #77 | Exceptional 4.9% |
| Okinawans | 97.9 /100 | #78 | Exceptional 4.9% |
| Canadians | 97.7 /100 | #79 | Exceptional 5.0% |
| Immigrants | Sweden | 97.6 /100 | #80 | Exceptional 5.0% |
| Basques | 97.6 /100 | #81 | Exceptional 5.0% |
| Fijians | 97.6 /100 | #82 | Exceptional 5.0% |
| Hmong | 97.6 /100 | #83 | Exceptional 5.0% |
| Russians | 97.4 /100 | #84 | Exceptional 5.0% |
Demographics Similar to Afghans by Unemployment
In terms of unemployment, the demographic groups most similar to Afghans are Nonimmigrants (5.3%, a difference of 0.030%), Malaysian (5.3%, a difference of 0.030%), Nicaraguan (5.3%, a difference of 0.080%), Taiwanese (5.3%, a difference of 0.14%), and Immigrants from Greece (5.3%, a difference of 0.15%).
| Demographics | Rating | Rank | Unemployment |
| Puget Sound Salish | 56.6 /100 | #171 | Average 5.2% |
| Immigrants | Vietnam | 52.5 /100 | #172 | Average 5.2% |
| Immigrants | Poland | 51.8 /100 | #173 | Average 5.3% |
| Immigrants | Congo | 50.0 /100 | #174 | Average 5.3% |
| Taiwanese | 49.6 /100 | #175 | Average 5.3% |
| Nicaraguans | 48.7 /100 | #176 | Average 5.3% |
| Immigrants | Nonimmigrants | 47.9 /100 | #177 | Average 5.3% |
| Afghans | 47.4 /100 | #178 | Average 5.3% |
| Malaysians | 46.8 /100 | #179 | Average 5.3% |
| Immigrants | Greece | 45.0 /100 | #180 | Average 5.3% |
| Albanians | 43.5 /100 | #181 | Average 5.3% |
| Spaniards | 42.2 /100 | #182 | Average 5.3% |
| Brazilians | 40.2 /100 | #183 | Average 5.3% |
| Assyrians/Chaldeans/Syriacs | 39.2 /100 | #184 | Fair 5.3% |
| Immigrants | Thailand | 38.9 /100 | #185 | Fair 5.3% |