Cypriot vs Immigrants from Morocco Unemployment
COMPARE
Cypriot
Immigrants from Morocco
Unemployment
Unemployment Comparison
Cypriots
Immigrants from Morocco
4.9%
UNEMPLOYMENT
97.9/ 100
METRIC RATING
77th/ 347
METRIC RANK
5.2%
UNEMPLOYMENT
59.1/ 100
METRIC RATING
169th/ 347
METRIC RANK
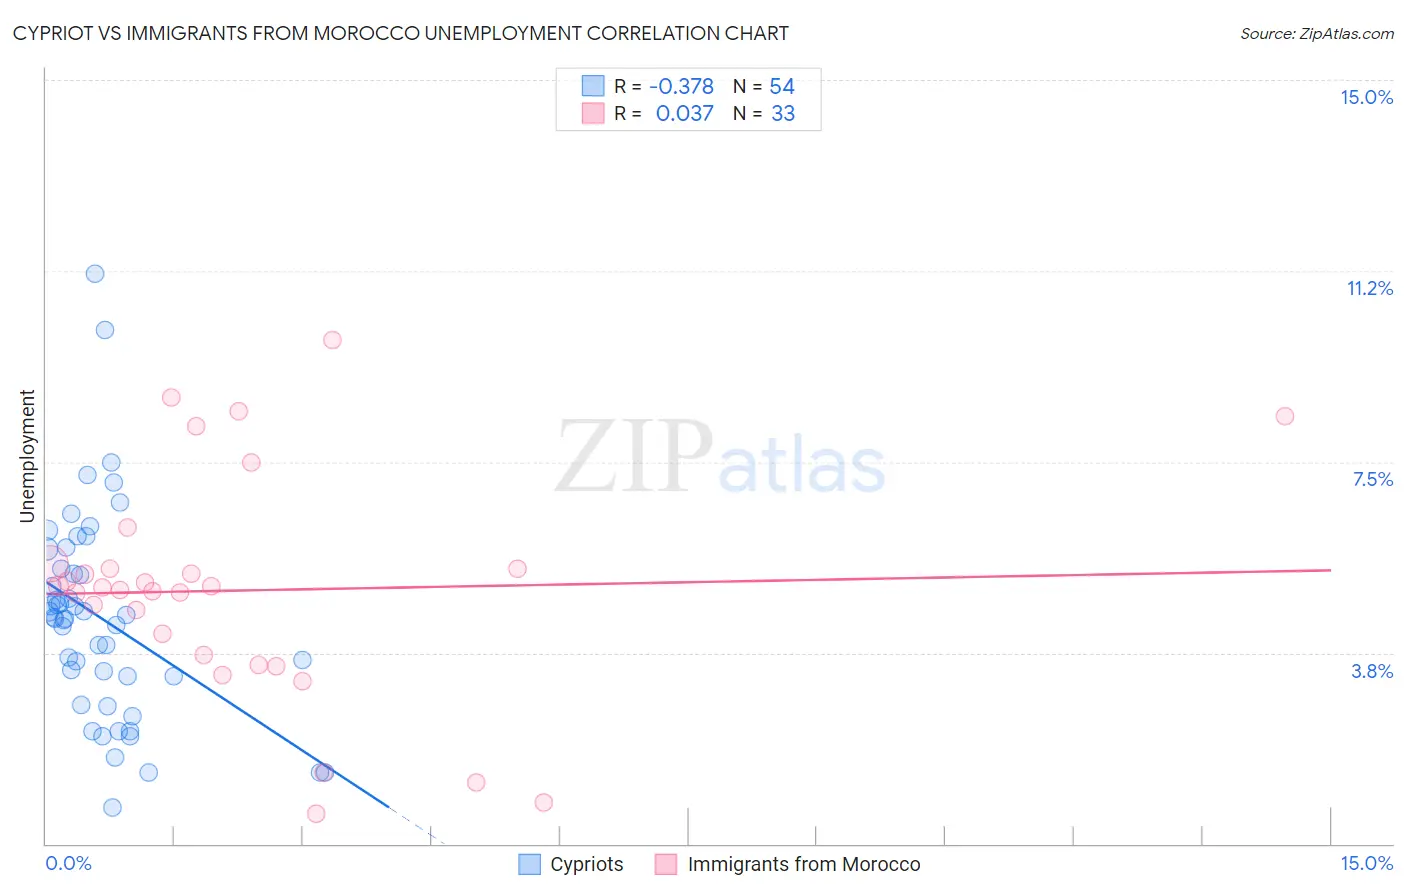
Cypriot vs Immigrants from Morocco Unemployment Correlation Chart
The statistical analysis conducted on geographies consisting of 61,864,376 people shows a mild negative correlation between the proportion of Cypriots and unemployment in the United States with a correlation coefficient (R) of -0.378 and weighted average of 4.9%. Similarly, the statistical analysis conducted on geographies consisting of 178,898,527 people shows no correlation between the proportion of Immigrants from Morocco and unemployment in the United States with a correlation coefficient (R) of 0.037 and weighted average of 5.2%, a difference of 5.7%.
Unemployment Correlation Summary
| Measurement | Cypriot | Immigrants from Morocco |
| Minimum | 0.70% | 0.60% |
| Maximum | 11.2% | 9.9% |
| Range | 10.5% | 9.3% |
| Mean | 4.4% | 5.0% |
| Median | 4.4% | 5.0% |
| Interquartile 25% (IQ1) | 3.3% | 3.6% |
| Interquartile 75% (IQ3) | 5.4% | 5.4% |
| Interquartile Range (IQR) | 2.1% | 1.8% |
| Standard Deviation (Sample) | 2.0% | 2.2% |
| Standard Deviation (Population) | 2.0% | 2.2% |
Similar Demographics by Unemployment
Demographics Similar to Cypriots by Unemployment
In terms of unemployment, the demographic groups most similar to Cypriots are Okinawan (4.9%, a difference of 0.040%), German Russian (4.9%, a difference of 0.060%), Turkish (4.9%, a difference of 0.080%), Canadian (5.0%, a difference of 0.16%), and Immigrants from Northern Europe (4.9%, a difference of 0.22%).
| Demographics | Rating | Rank | Unemployment |
| Serbians | 98.4 /100 | #70 | Exceptional 4.9% |
| Immigrants | Japan | 98.3 /100 | #71 | Exceptional 4.9% |
| Burmese | 98.3 /100 | #72 | Exceptional 4.9% |
| Paraguayans | 98.3 /100 | #73 | Exceptional 4.9% |
| Immigrants | Northern Europe | 98.2 /100 | #74 | Exceptional 4.9% |
| Turks | 98.0 /100 | #75 | Exceptional 4.9% |
| German Russians | 98.0 /100 | #76 | Exceptional 4.9% |
| Cypriots | 97.9 /100 | #77 | Exceptional 4.9% |
| Okinawans | 97.9 /100 | #78 | Exceptional 4.9% |
| Canadians | 97.7 /100 | #79 | Exceptional 5.0% |
| Immigrants | Sweden | 97.6 /100 | #80 | Exceptional 5.0% |
| Basques | 97.6 /100 | #81 | Exceptional 5.0% |
| Fijians | 97.6 /100 | #82 | Exceptional 5.0% |
| Hmong | 97.6 /100 | #83 | Exceptional 5.0% |
| Russians | 97.4 /100 | #84 | Exceptional 5.0% |
Demographics Similar to Immigrants from Morocco by Unemployment
In terms of unemployment, the demographic groups most similar to Immigrants from Morocco are Uruguayan (5.2%, a difference of 0.070%), Immigrants from Nicaragua (5.2%, a difference of 0.12%), Colombian (5.2%, a difference of 0.13%), Immigrants from Indonesia (5.2%, a difference of 0.14%), and Puget Sound Salish (5.2%, a difference of 0.16%).
| Demographics | Rating | Rank | Unemployment |
| Spanish | 65.1 /100 | #162 | Good 5.2% |
| Immigrants | Zaire | 64.7 /100 | #163 | Good 5.2% |
| Immigrants | Colombia | 64.7 /100 | #164 | Good 5.2% |
| Immigrants | Brazil | 63.1 /100 | #165 | Good 5.2% |
| Immigrants | Indonesia | 61.2 /100 | #166 | Good 5.2% |
| Colombians | 61.1 /100 | #167 | Good 5.2% |
| Uruguayans | 60.2 /100 | #168 | Good 5.2% |
| Immigrants | Morocco | 59.1 /100 | #169 | Average 5.2% |
| Immigrants | Nicaragua | 57.1 /100 | #170 | Average 5.2% |
| Puget Sound Salish | 56.6 /100 | #171 | Average 5.2% |
| Immigrants | Vietnam | 52.5 /100 | #172 | Average 5.2% |
| Immigrants | Poland | 51.8 /100 | #173 | Average 5.3% |
| Immigrants | Congo | 50.0 /100 | #174 | Average 5.3% |
| Taiwanese | 49.6 /100 | #175 | Average 5.3% |
| Nicaraguans | 48.7 /100 | #176 | Average 5.3% |